
One layer on top of the tools you already use.
Hobasa reads across finance, workforce, and compliance systems to surface the gaps costing you performance, profit, and speed.
Enterprise-wide intelligence beyond individual systems.
Business performance is determined by how systems work together - not by how they operate independently. Hobasa continuously analyzes relationships across your business ecosystem, revealing hidden dependencies, operational friction and opportunities that traditional reporting cannot detect.
Every system maps into one comparable model. Where two systems disagree, we keep both numbers instead of quietly picking one - the disagreement is the finding.
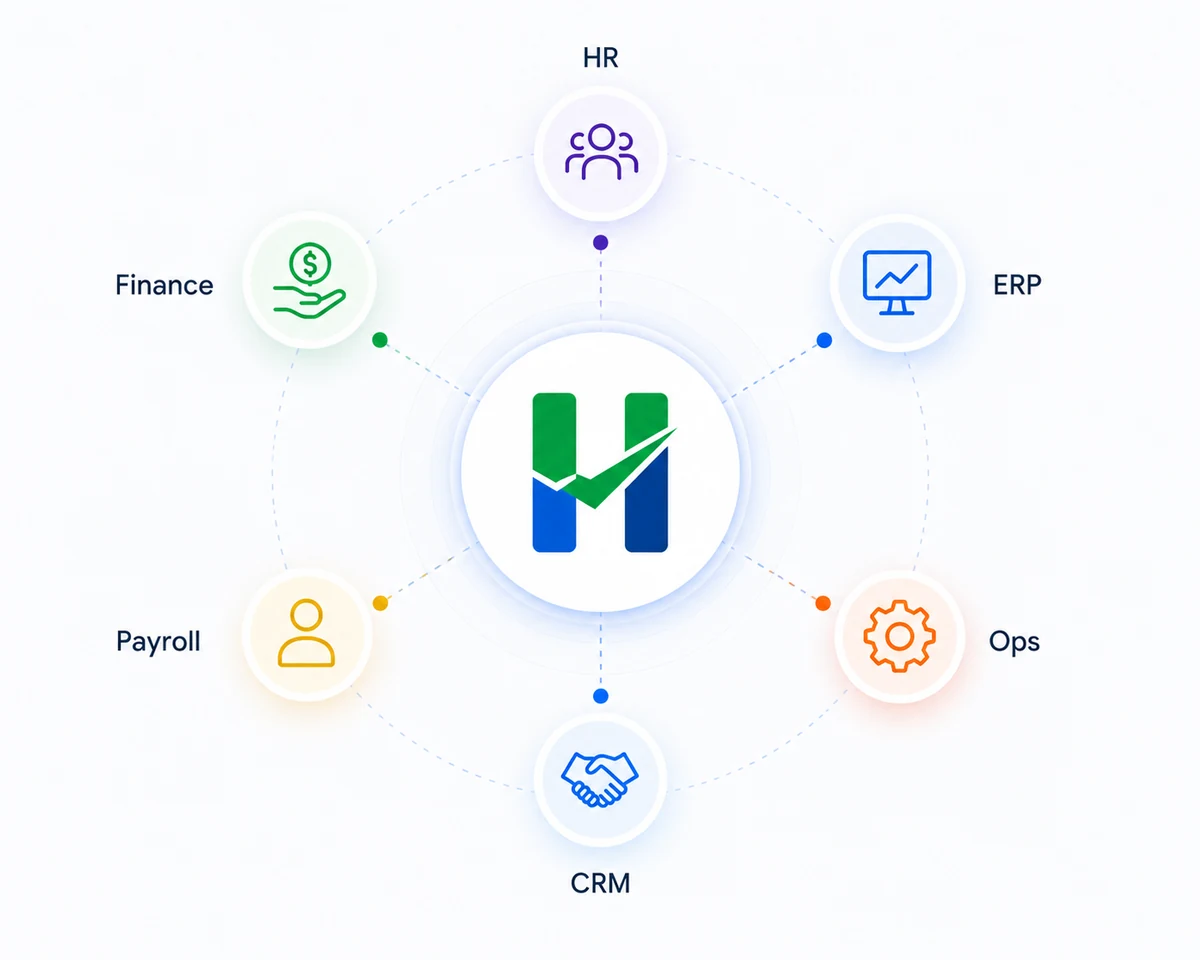
We connect to the systems already in place. No migration, no rip and replace, no change to the day-to-day - every connected system simply becomes part of one analytical view.
Understand how a change in one function moves outcomes elsewhere. Surface the relationships, patterns and dependencies that drive operational performance and financial results.
Sample data - for illustration only. Company names and figures are fictional.
Continuous visibility into business performance.
Move beyond static dashboards. The platform continuously evaluates operational activity, monitors critical business signals and surfaces emerging issues as they develop.
Wage laws, tax thresholds, benefit limits and vertical policies change. Compliance monitoring re-runs the checks so anomalies surface the moment a requirement shifts, not months later at audit.
Every anomaly arrives with the rule it broke, the systems it spans and the source records behind it, so your team can act on it rather than just read it.
Rules do the detecting. The AI explains rather than decides, and a person signs off before a finding reaches you.
Every finding links back to the records it came from, so you can check the number instead of trusting it.
Continuous assurance across regulatory and business obligations.
Embed compliance into day-to-day operations through automated monitoring that reduces manual oversight while strengthening governance and organizational confidence.
Continuously monitor financial, payroll, workforce and statutory obligations. Exceptions surface before they become business risks.
- Financial controls
- Payroll & tax
- Workforce & HR
- Sector-specific
Validate adherence to approval workflows, delegated authority and operational controls across every department - strengthening governance while reducing exposure.
- Policy adherence
- Approval workflows
- Segregation of duties
- Audit trail
Anticipate change. Act with confidence.
Convert historical and real-time operational data into forward-looking intelligence that enables leadership to anticipate disruption, optimize performance and improve strategic outcomes.
Forecast financial performance, workforce dynamics, operational capacity and emerging business patterns from historical and live signals.
Equip executives with predictive recommendations that support earlier intervention, smarter resource allocation and more confident strategic decision-making.
Sample data - for illustration only. Company names and figures are fictional.
Measure performance against what matters.
Evaluate business performance using standardized analytical frameworks and meaningful industry comparisons that provide objective context for every executive decision.
Illustrative comparison. Figures are fictional.
Sample data - for illustration only. Company names and figures are fictional.
Enterprise-ready analytical models covering Finance, HR, operational efficiency and organizational performance - ship insight in weeks, not quarters.
Compare KPIs against published industry benchmarks where a licensed source is available for your sector.
Sample data - for illustration only. Company names and figures are fictional.
Detect the signals others overlook.
The platform continuously identifies unusual patterns, hidden operational risks and performance anomalies before they materially impact profitability or execution.
Reveal revenue leakage, control failures, process inefficiencies and data inconsistencies across connected systems, enabling rapid corrective action.
Predict emerging operational and financial risks by recognizing subtle behavioral patterns long before conventional reporting surfaces them.
Intelligence that demands attention - not distraction.
Deliver context-aware alerts that prioritize material business events while eliminating unnecessary operational noise.
Correlate related events across Finance, HR and operational systems to present a complete business narrative instead of isolated system notifications.
Prioritization suppresses low-value alerts, so leadership focuses on the issues with the greatest strategic and operational impact.
Sample data - for illustration only. Company names and figures are fictional.
From connected data to work that gets done.
Securely link finance, HR, ERP, CRM, payroll and operational systems. Read-only by default.
Map every system into one comparable model and surface where the numbers disagree.
Rules and grounded AI find the gaps; a person reviews each finding before it reaches you.
Checks keep running as rules and data change, with prioritized findings routed to the right owner.
Nothing reaches you unchecked.
Rules and models do the detecting. A qualified reviewer validates each finding before it leaves the platform, so what you receive is something you can put in front of a board or an auditor.
Every finding is reviewed against the source records before it is released. Anything that cannot be evidenced is not sent.
Each finding states what was found, which systems it spans, why it matters and what to do next - no model output handed over raw.
Reviewer decisions tune thresholds and rules over time, so precision improves and noise falls with use.
Adaptive rules and grounded models run continuously across the canonical model.
A reviewer confirms the evidence, removes false positives and adds business context.
Only validated, traceable findings are delivered to your team.
Built to sit inside an enterprise, not beside it.
A productised deployment with the architecture, security and data handling your IT, security and audit teams already expect.
A repeatable deployment measured in weeks - typically 3–4 - rather than a custom build with an open-ended timeline.
We connect to your existing systems. No migration, no rip and replace, no workflow change for your teams.
Logical isolation per tenant, with encryption in transit and at rest across every connection.
Access is scoped to what the checks need. Write access is only granted where you explicitly ask for it.
ISO 27001 – Certified. SOC 2 Type II Certified.
Your data is never used to train any external model. Where a model provider processes data in order to return your result, it does so under contract, on scrubbed and minimized inputs.
Measure on day one
KPIs available in the product today.
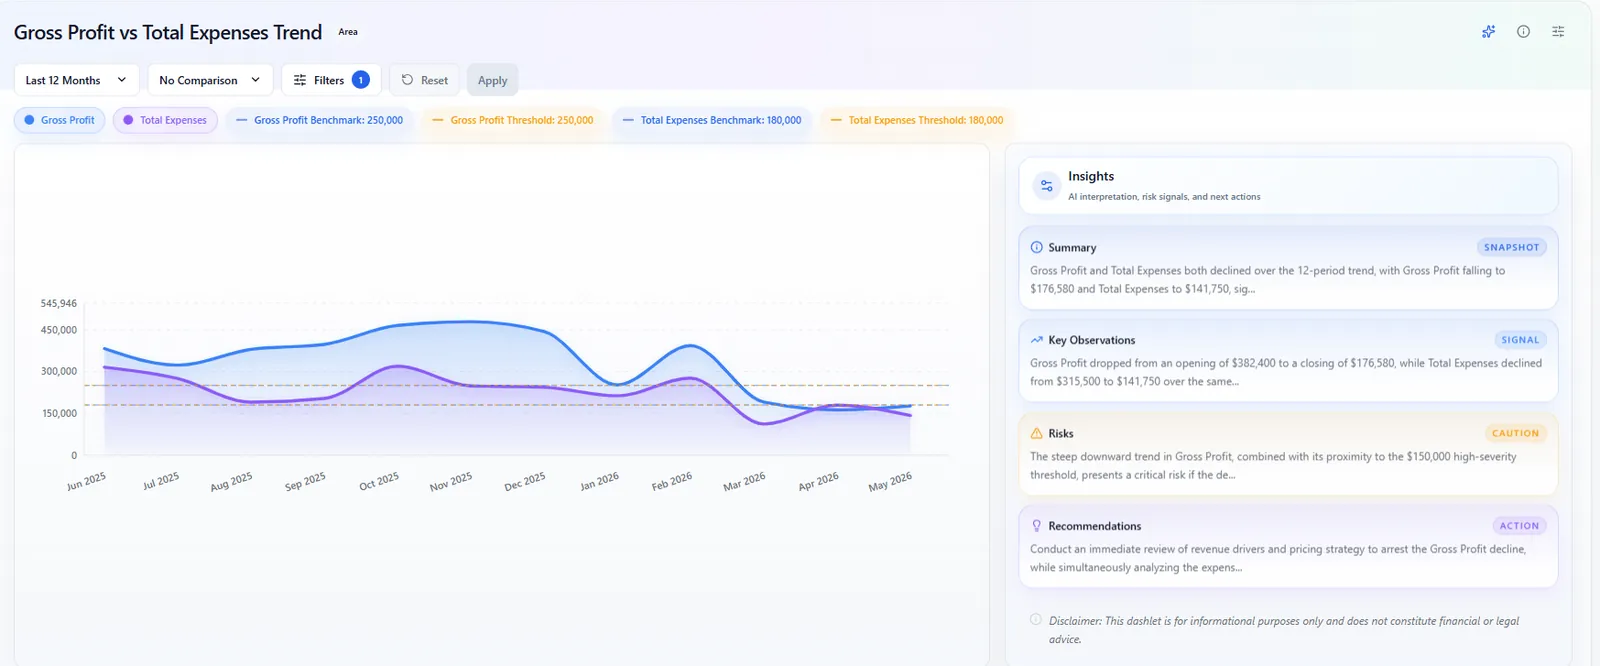
Every KPI is calculated from your connected systems and paired with an AI summary, key observations, risks and recommended next actions - not a raw number on a chart.
Finance KPIs
- Revenue Leakage %
Dollars slipping through billing, discounts and unapplied payments.
- Expense-to-Revenue Ratio
How much of every dollar earned is consumed by operating costs.
- Cash Conversion Ratio
Cash + AR vs AP - how quickly earned revenue becomes usable cash.
- Revenue Realization Rate
Booked revenue that actually converts to collected revenue.
- Profit Velocity Index
Direction and speed of net income across periods.
- Operating Profit Margin
Core profitability after operating expenses, before tax and interest.
HR KPIs
- Workforce Health Score AI
Composite view of engagement, tenure and productivity signals.
- Burnout Risk Score AI
Early-warning signal from workload, hours and time-off patterns.
- Payroll Anomaly Score AI
Unusual pay, hours or classification patterns flagged for review.
- Regulatory Compliance Risk
Exposure across labor, tax and workforce reporting obligations, calculated through compliance monitoring rather than a model.
- Forecasted Attrition AI
Predicted departures over the next 1–2 quarters, by team and role.
- Quality of Hire Score AI
Post-hire performance, retention and ramp signals rolled into one score.
AI marks a KPI where a model produces the score. KPIs without the tag are calculated through compliance monitoring across your connected systems. All KPIs on this list, tagged or not, can be asked about in Conversational AI.
Live product views
Every KPI comes with context - not just a chart.
Sample data - for illustration only. Company names and figures are fictional.