- Business revenue leakage is money a company has already earned but fails to collect, and it typically hides in the gaps between disconnected systems rather than inside any single one.
- Research cited from McKinsey suggests organizations can lose 15% to 20% of revenue to process inefficiencies across the revenue cycle, while a rule of thumb from NetSuite puts the earnings impact of leakage at 1% to 5% for a typical company.
- Ten specific, recognizable signs point to revenue leakage between systems, from manual reconciliation habits to leadership not being able to quickly explain why a number changed.
- Identifying leakage requires comparing what different systems say about the same transaction, not just monitoring each system in isolation.
- Below: what revenue leakage actually is, the 10 signs to watch for, a practical framework for identifying it, and how to prevent it before it compounds.
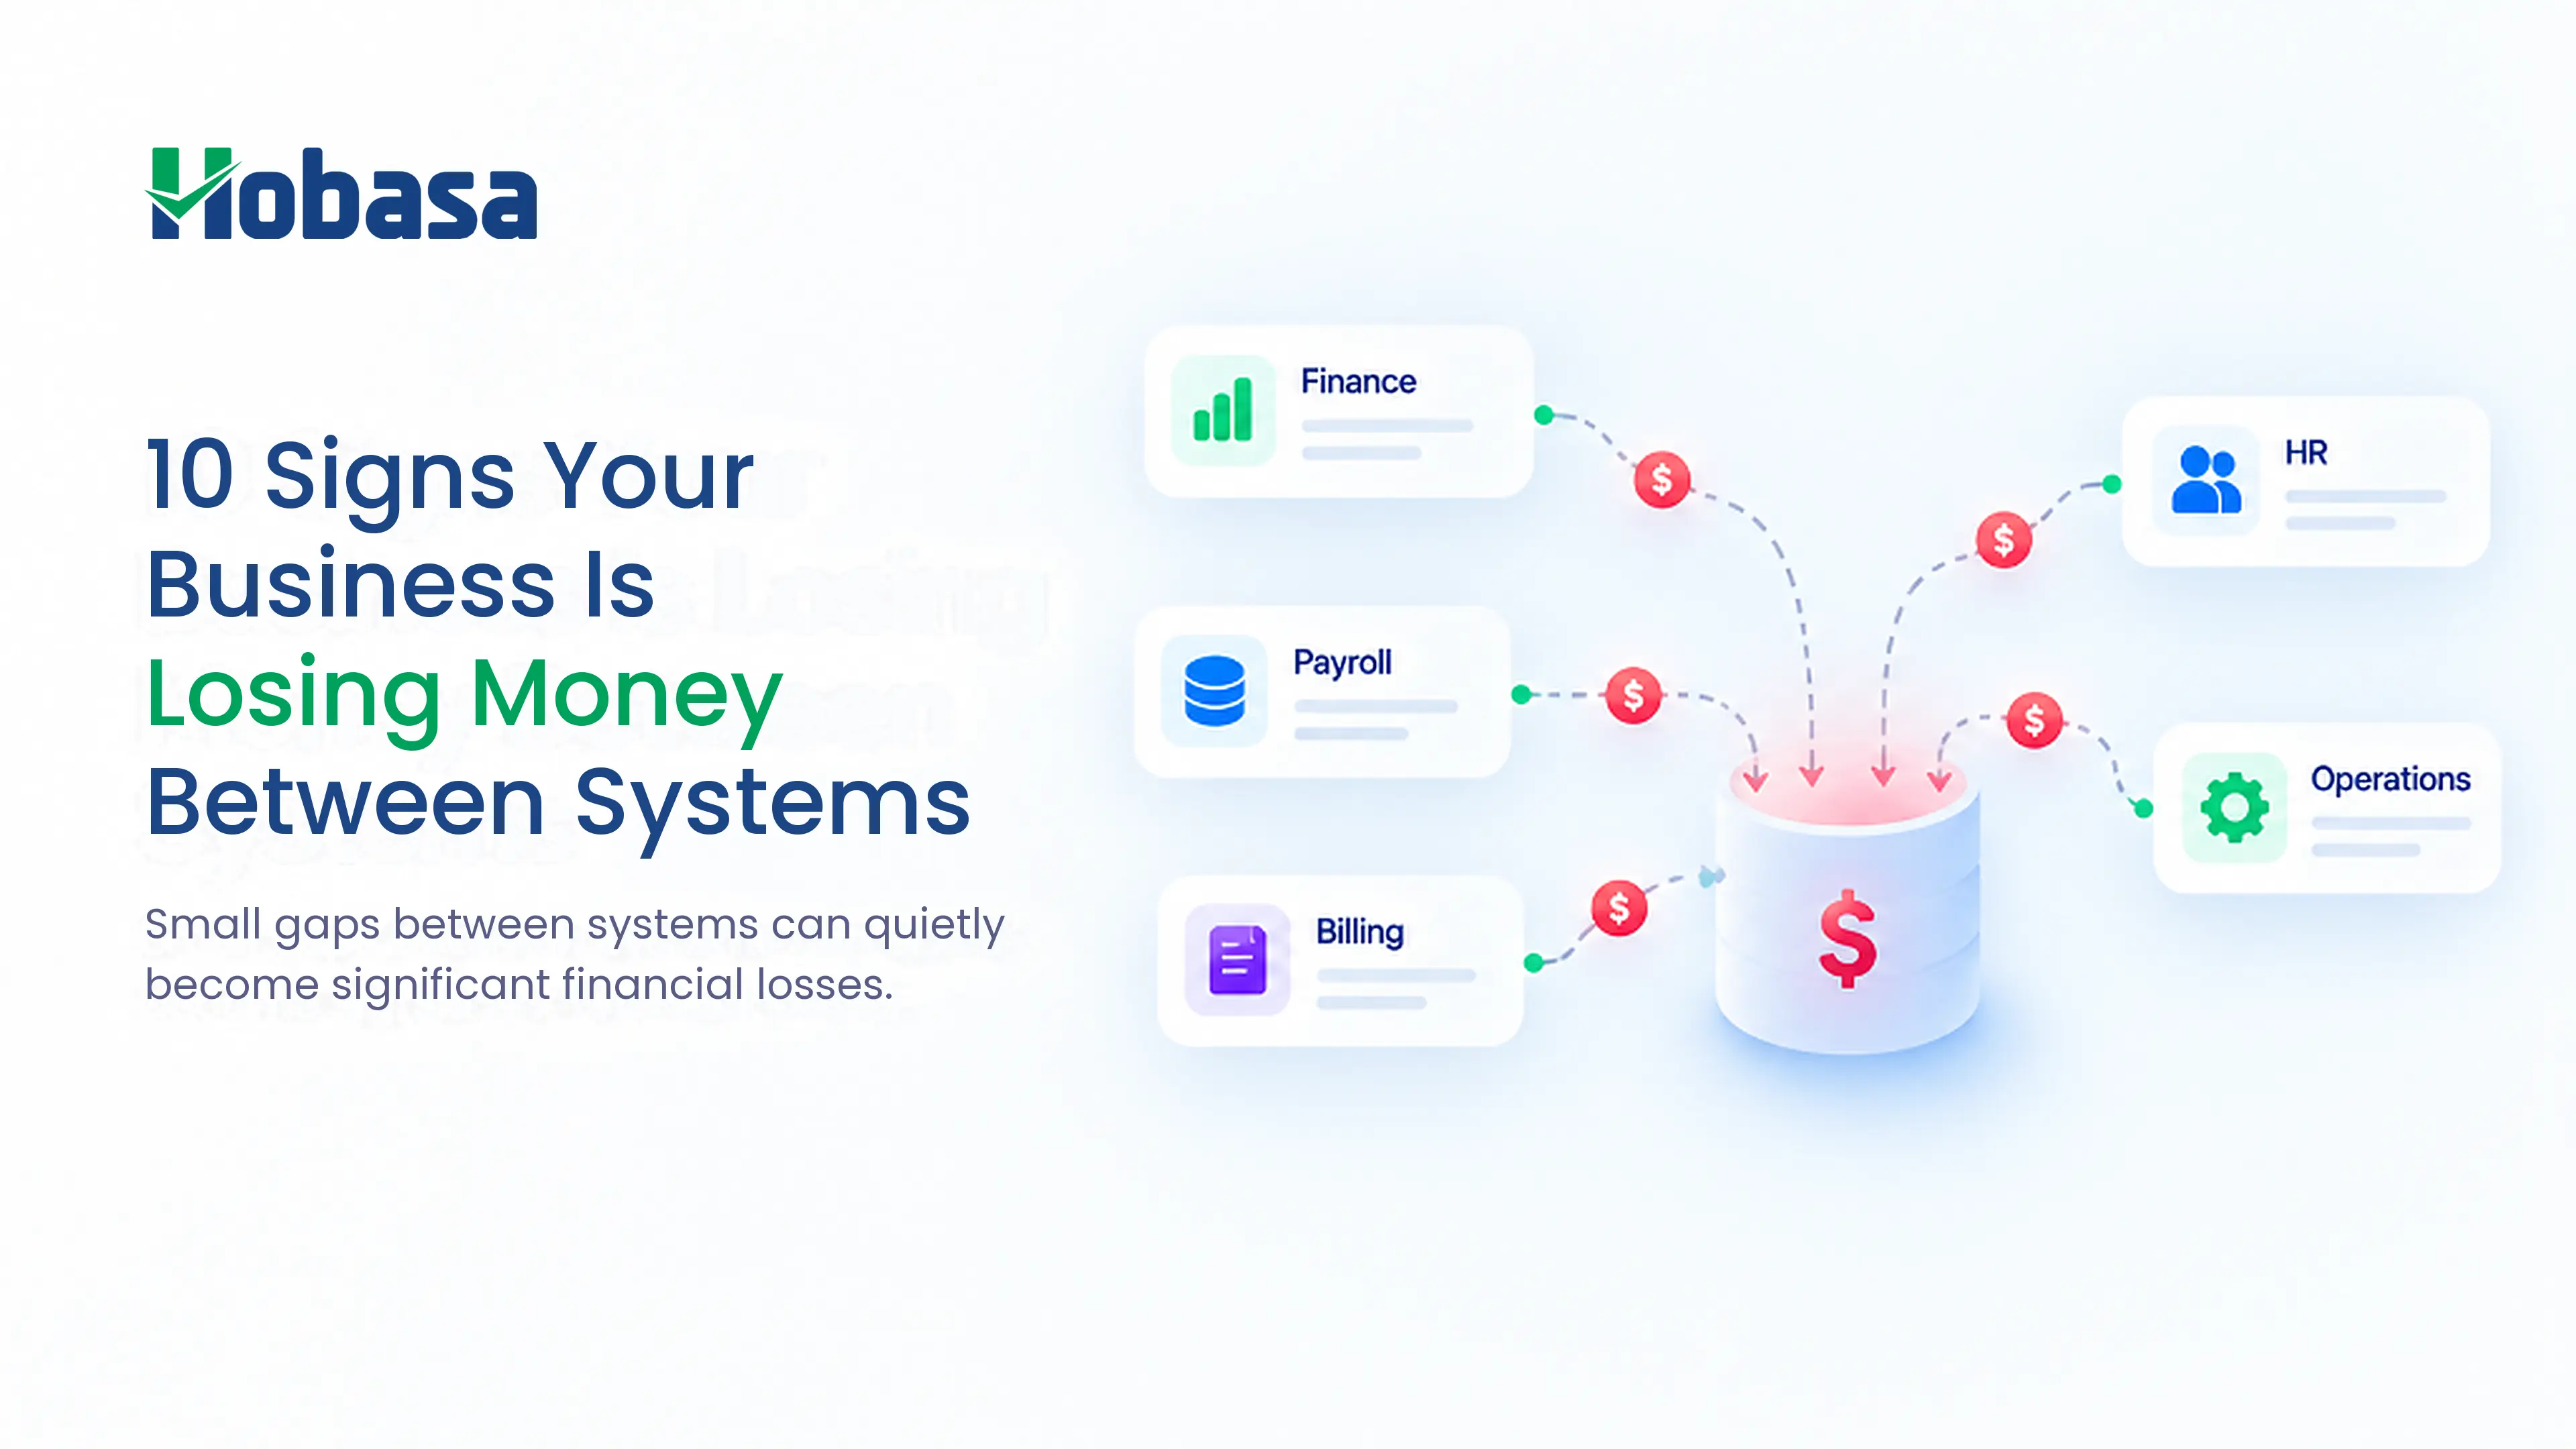
Why do businesses lose money between systems? Because most companies run on a patchwork of separate tools, ERP, CRM, payroll, HR, accounting, spreadsheets, procurement, operations, and billing, that were never built to reconcile with each other automatically. When a deal closes in the CRM but doesn't trigger an invoice, when payroll data doesn't match what finance budgeted, or when a pricing error sits unnoticed for a full quarter, the business loses money not because any one system failed, but because nothing was watching the space between them. This pattern has a name: business revenue leakage.
What Is Revenue Leakage?
Revenue leakage is money a business has already earned through delivered goods or services but fails to collect or properly record, usually because of gaps between systems, manual processes, or inconsistent data rather than a single obvious error. In practice, most business revenue leakage is not one dramatic failure. It is a pattern of small, repeated gaps that compound quietly over time.
It is different from a sale that never happened. The work was done, the product shipped, or the service delivered. The money simply never made it fully into the business's accounts, or it arrived late, incomplete, or miscounted. Common, concrete examples include a completed project that was never fully invoiced, a discount applied without approval that quietly erodes margin, a duplicate payment made to a vendor, or a customer contract renewal that lapsed without anyone noticing the missed billing cycle.
According to a rule of thumb reported by NetSuite, companies dealing with revenue leakage typically see earnings that are 1% to 5% lower as a result, and a 2020 Boston Consulting Group survey found that 45% of executives see revenue leakage as a systematic problem in their own organization, not an occasional accident.
Why Do Businesses Lose Money Between Systems?
Revenue leakage rarely comes from one bad decision. It comes from the accumulated friction of disconnected business systems, manual processes, delayed information, inconsistent data, approval gaps, and billing issues, all interacting at once. Left unaddressed, these business process inefficiencies compound quarter over quarter rather than resolving on their own.
When a CRM, an ERP, payroll, HR, and a billing system all hold a different piece of the same business event, each system can be technically correct and the overall picture can still be wrong. A CRM record showing a deal as closed does not guarantee the billing system generated an invoice. An HRIS showing a role as part-time does not guarantee payroll is running that person at part-time hours. Nobody owns the comparison between the two, so the gap sits there until someone happens to notice it, usually much later than it started.
Analysis cited from McKinsey suggests organizations can lose 15% to 20% of revenue to process inefficiencies of exactly this kind, spread across delays, manual work errors, and friction in billing, contracting, and service delivery. This lines up with a related pattern discussed in disconnected finance systems that already cost businesses more than they realize, often well before leadership has a name for what's causing the drag. Separately, 2025 research from KPMG, reported via Outreach, found that fragmented systems create measurable, specific leakage: 33% of organizations miss cross-sell opportunities, 26% lose upsell revenue, and 27% experience order activation delays, all tied directly to systems that don't share information cleanly.
| Problem | What Happens | Financial Impact |
|---|---|---|
| Disconnected systems | Data does not flow correctly between CRM, billing, ERP, HR, and payroll | Missed or delayed revenue |
| Manual processes | Reconciliation depends on people remembering to check, and errors and delays increase | Higher operating costs, slower close cycles |
| Data silos | Teams work from incomplete or outdated information | Poor decisions made on partial data |
| Approval gaps | Discounts, credits, or exceptions get applied without a consistent check | Margin erosion that compounds over time |
| Delayed reporting | Issues surface only at month-end or during an audit | Problems grow before anyone notices them |
10 Signs Your Business Is Losing Money Between Systems in 2026
1. Finance teams constantly reconcile data manually: If your finance team spends a meaningful part of every close cycle manually comparing numbers between systems, exporting a report from one platform and cross-checking it against another by hand, that habit is usually compensating for a connection that doesn't exist. A common example: an accounts payable analyst manually matching vendor invoices in the ERP against a separate procurement platform because the two were never actually linked.
The financial leakage here is indirect but real: manual reconciliation is slow enough that errors slip through simply because nobody has time to check everything, every month. Monitor the hours spent on manual reconciliation per close cycle, and track whether that number is going up as the business adds more systems and more transaction volume.
2. Different systems show different numbers for the same thing: When the HRIS, payroll, and finance systems each report a different headcount or labor cost for the same period, none of them is necessarily wrong. Each is accurately reporting what it was told, at a different moment, using a slightly different definition. The business impact shows up when a budget decision, a hiring freeze, or a board report gets built on whichever number happened to be open at the time.
Watch the variance between systems that should theoretically agree, headcount across HRIS and payroll, or revenue across a CRM and the general ledger, as a direct, trackable metric rather than something discovered by accident.
3. Revenue and invoices do not match: A deal marked "closed won" in the CRM is not the same thing as a completed, collected invoice. When the handoff between sales systems and billing systems is manual or incomplete, a real, delivered sale can sit unbilled for weeks, or get billed for the wrong amount. This is one of the most direct forms of revenue leakage, because the money was earned and the business simply never asked for it.
Track billed revenue against recognized or delivered revenue for the same period, and treat any persistent gap as leakage worth investigating, not rounding error.
4. Discounts, pricing, or billing errors go unnoticed: A sales rep applies an unauthorized discount to close a deal faster. A pricing tier gets misconfigured in the billing system. A customer is quietly grandfathered into an old rate that should have expired a year ago. None of these look like fraud. They look like small, individually forgivable exceptions, and they are exactly the kind of thing that survives for quarters because no one is comparing actual billed prices against the approved price list at scale.
Monitor a discount leakage rate or price realization rate, the gap between list price and what actually gets billed, as a recurring metric rather than a one-time pricing audit. Left unmonitored, this specific pattern is one of the most common forms of business revenue leakage in any company with a sales team empowered to negotiate.
5. Sales opportunities fall through system handoffs: Between a CRM marking a deal closed and a billing system generating the first invoice, there is a handoff, and handoffs are where things get dropped. A deal can close, sit in a queue waiting for manual provisioning, and never make it to billing at all, especially in businesses with any kind of custom onboarding or implementation step.
Track the lead-to-cash cycle time and specifically the drop-off rate between "deal closed" and "first invoice sent." A widening gap here is often the earliest visible sign of a handoff problem.
6. Payroll and workforce data are disconnected from financial planning: A headcount plan built in the HRIS and a labor budget built in finance frequently diverge quietly. New hires get approved outside the planning cycle, contractors get classified inconsistently, and by the time someone compares actual payroll cost to the budget, the variance has been compounding for months.
Monitor budgeted versus actual workforce cost as a standing comparison, not a quarterly surprise, and flag any month where the two diverge by more than a small, predefined threshold.
7. Managers discover problems only after month-end reporting: If the first time anyone sees a margin drop, a cost spike, or an unusual pattern is during the monthly close, the business is finding out about problems weeks after they started. A margin issue that began in the first week of the month is often invisible until the reporting cycle catches up to it three or four weeks later. This is exactly the cost of delayed data: the problem was real from day one, and only the awareness of it was late.
Track the time-to-detection lag, the gap between when an issue actually started and when someone in the business first noticed it. Shrinking that lag is one of the highest-leverage things a business can do to stop leakage from compounding.
8. Operational inefficiencies increase without clear visibility: Fulfillment delays, scheduling gaps, or capacity mismatches often show up first as customer complaints or missed SLAs, not as a line item anyone was tracking. These operational inefficiencies are a direct downstream effect of disconnected business systems that were never built to flag a slowdown to anyone outside the department where it started. By the time the pattern is obvious enough to act on, it has usually been costing money for a while.
Watch process cycle times as a trend, not a snapshot, since a one-month blip is noise but a three-month climb is usually a real, ongoing cost.
9. Business teams rely heavily on spreadsheets to make decisions: Spreadsheets are not the problem by themselves. The problem is what a heavy reliance on them usually signals: that no system currently connects the data automatically, so someone is manually pulling exports from three or four platforms and stitching them together every time a decision needs to be made.
Count the number of manual spreadsheet touchpoints behind your most important recurring report. If a single monthly dashboard requires pulling from more than two or three systems by hand, that report is a leakage risk every time someone builds it slightly differently than last month.
10. Leadership cannot quickly determine why revenue, margin, or costs changed: This is often the clearest symptom of all the others combined. A board or leadership team asks why margin dropped two points, and the honest answer is that it will take the finance team a week or two to trace it back to a cause. That delay is not a reporting inconvenience. It is a sign that the underlying systems don't talk to each other well enough to answer a basic business question quickly.
Track time-to-root-cause for a typical variance question as its own metric. If it consistently takes more than a few days to explain a meaningful financial change, the gap is structural, not a one-off.
Seeing these signs in your business?
Hobasa connects Finance, HR, Payroll, and Operations so the gaps between systems surface early, before they show up as unexplained margin loss.
Talk to our teamHow to Identify Revenue Leakage in Your Business in 2026
Finding business revenue leakage is less about auditing any single system and more about comparing what different systems say about the same thing.
What to compare:
- Headcount reported by the HRIS versus headcount reflected in payroll
- Deals marked closed in the CRM versus invoices actually generated in billing
- Budgeted labor and operating cost versus actual spend by department
- List prices versus realized, billed prices across a sample of recent transactions
- Vendor payments versus purchase orders and received goods or services
Which systems to review: start with whichever two systems are supposed to agree but rarely get directly compared, most commonly HRIS-to-payroll, CRM-to-billing, and budget-to-actual in finance.
Which KPIs to monitor:
| KPI | What it reveals |
|---|---|
| Reconciliation hours per close cycle | How much manual work is compensating for missing automation |
| Headcount or cost variance across systems | Whether HR, payroll, and finance agree on the same numbers |
| Billed vs. recognized revenue gap | Whether closed deals are actually reaching an invoice |
| Discount or price realization rate | Whether pricing exceptions are creeping past approved limits |
| Time-to-root-cause for a variance | How quickly the business can explain what changed and why |
Where mismatches commonly happen: at every handoff point between systems, sales to billing, HR to payroll, procurement to accounts payable, and budget to actual reporting. How to spot recurring patterns: look for the same type of discrepancy appearing in more than one period, since a single-month anomaly is often noise, but the same gap reappearing month after month is a process issue. How to prioritize: rank potential leakage sources by dollar exposure first, then by how frequently the pattern recurs, since a small but constant leak often costs more over a year than a large one-time error.
Ready to stop guessing where the money goes?
Hobasa compares what Finance, HR, Payroll, and Operations each report, so leakage shows up as a clear discrepancy, not a month-end surprise.
Talk to our teamHow Data Silos Create Hidden Business Costs
Data silos in business are not just a technical inconvenience. They are one of the most common sources of hidden costs in business operations, showing up as a wrong or late decision, made because the people making it didn't have the full picture.
When Finance, HR, Payroll, Sales, and Operations each hold a different slice of the truth, leadership ends up choosing which slice to trust, often without realizing a choice is even being made. A hiring decision approved by HR might look financially sound in isolation and still strain a budget that Finance was tracking separately. A sales team hitting its targets might be doing so with pricing exceptions that Finance never sees until the margin report comes out weeks later.
The real cost of a data silo is rarely visible in the silo itself. It shows up downstream, in a decision that looked reasonable at the time and turned out to be based on an incomplete picture. That is a harder cost to quantify than a missed invoice, and it is often larger, which is exactly why business revenue leakage tends to go undiagnosed for so long.
Break the silos without replacing your stack.
Keep the systems you already run. Hobasa reads across them and flags the mismatches that create hidden cost, so leadership decides from one shared picture.
Get in touchHow to Prevent Revenue Leakage
Preventing leakage is less about finding every individual error and more about building the habits and connections that keep new leakage from accumulating. Most of what follows targets the same root cause: business process inefficiencies that were allowed to become permanent instead of getting fixed once and closed out.
Connect the systems that are supposed to agree. HRIS to payroll, CRM to billing, budget to actual. Manual reconciliation should be the exception, not the monthly routine.
Improve data consistency at the source. A discount, a classification, or a price change should follow the same approval path every time, not depend on who happened to enter it.
Automate repetitive reconciliation. If the same comparison gets made by hand every month, it is a candidate for automation, not a permanent job description.
Monitor KPIs continuously, not just at close. A variance caught in week two is a quick fix. The same variance caught at month-end is an explanation owed to leadership.
Create cross-functional visibility. Finance, HR, and operations should be looking at a shared, reconciled view of the numbers that affect all three, not three separate versions of the truth.
Detect anomalies earlier. The goal is to catch the pattern before it becomes a trend, not to explain the trend after it has already cost real money.
Establish clear ownership of business metrics. Every KPI that matters should have someone responsible for noticing when it moves, not just someone who reports it once a month. For finance leaders managing complex financial signals across multiple business units or entities, this ownership question only gets harder as the organization grows, which is exactly where a cross-system view starts to matter more than another spreadsheet template.
How Hobasa Helps Businesses Connect the Dots
Closing the gap between systems is not primarily a software problem to buy your way out of. It's a visibility problem, and visibility requires someone, or something, actually comparing what each system says.
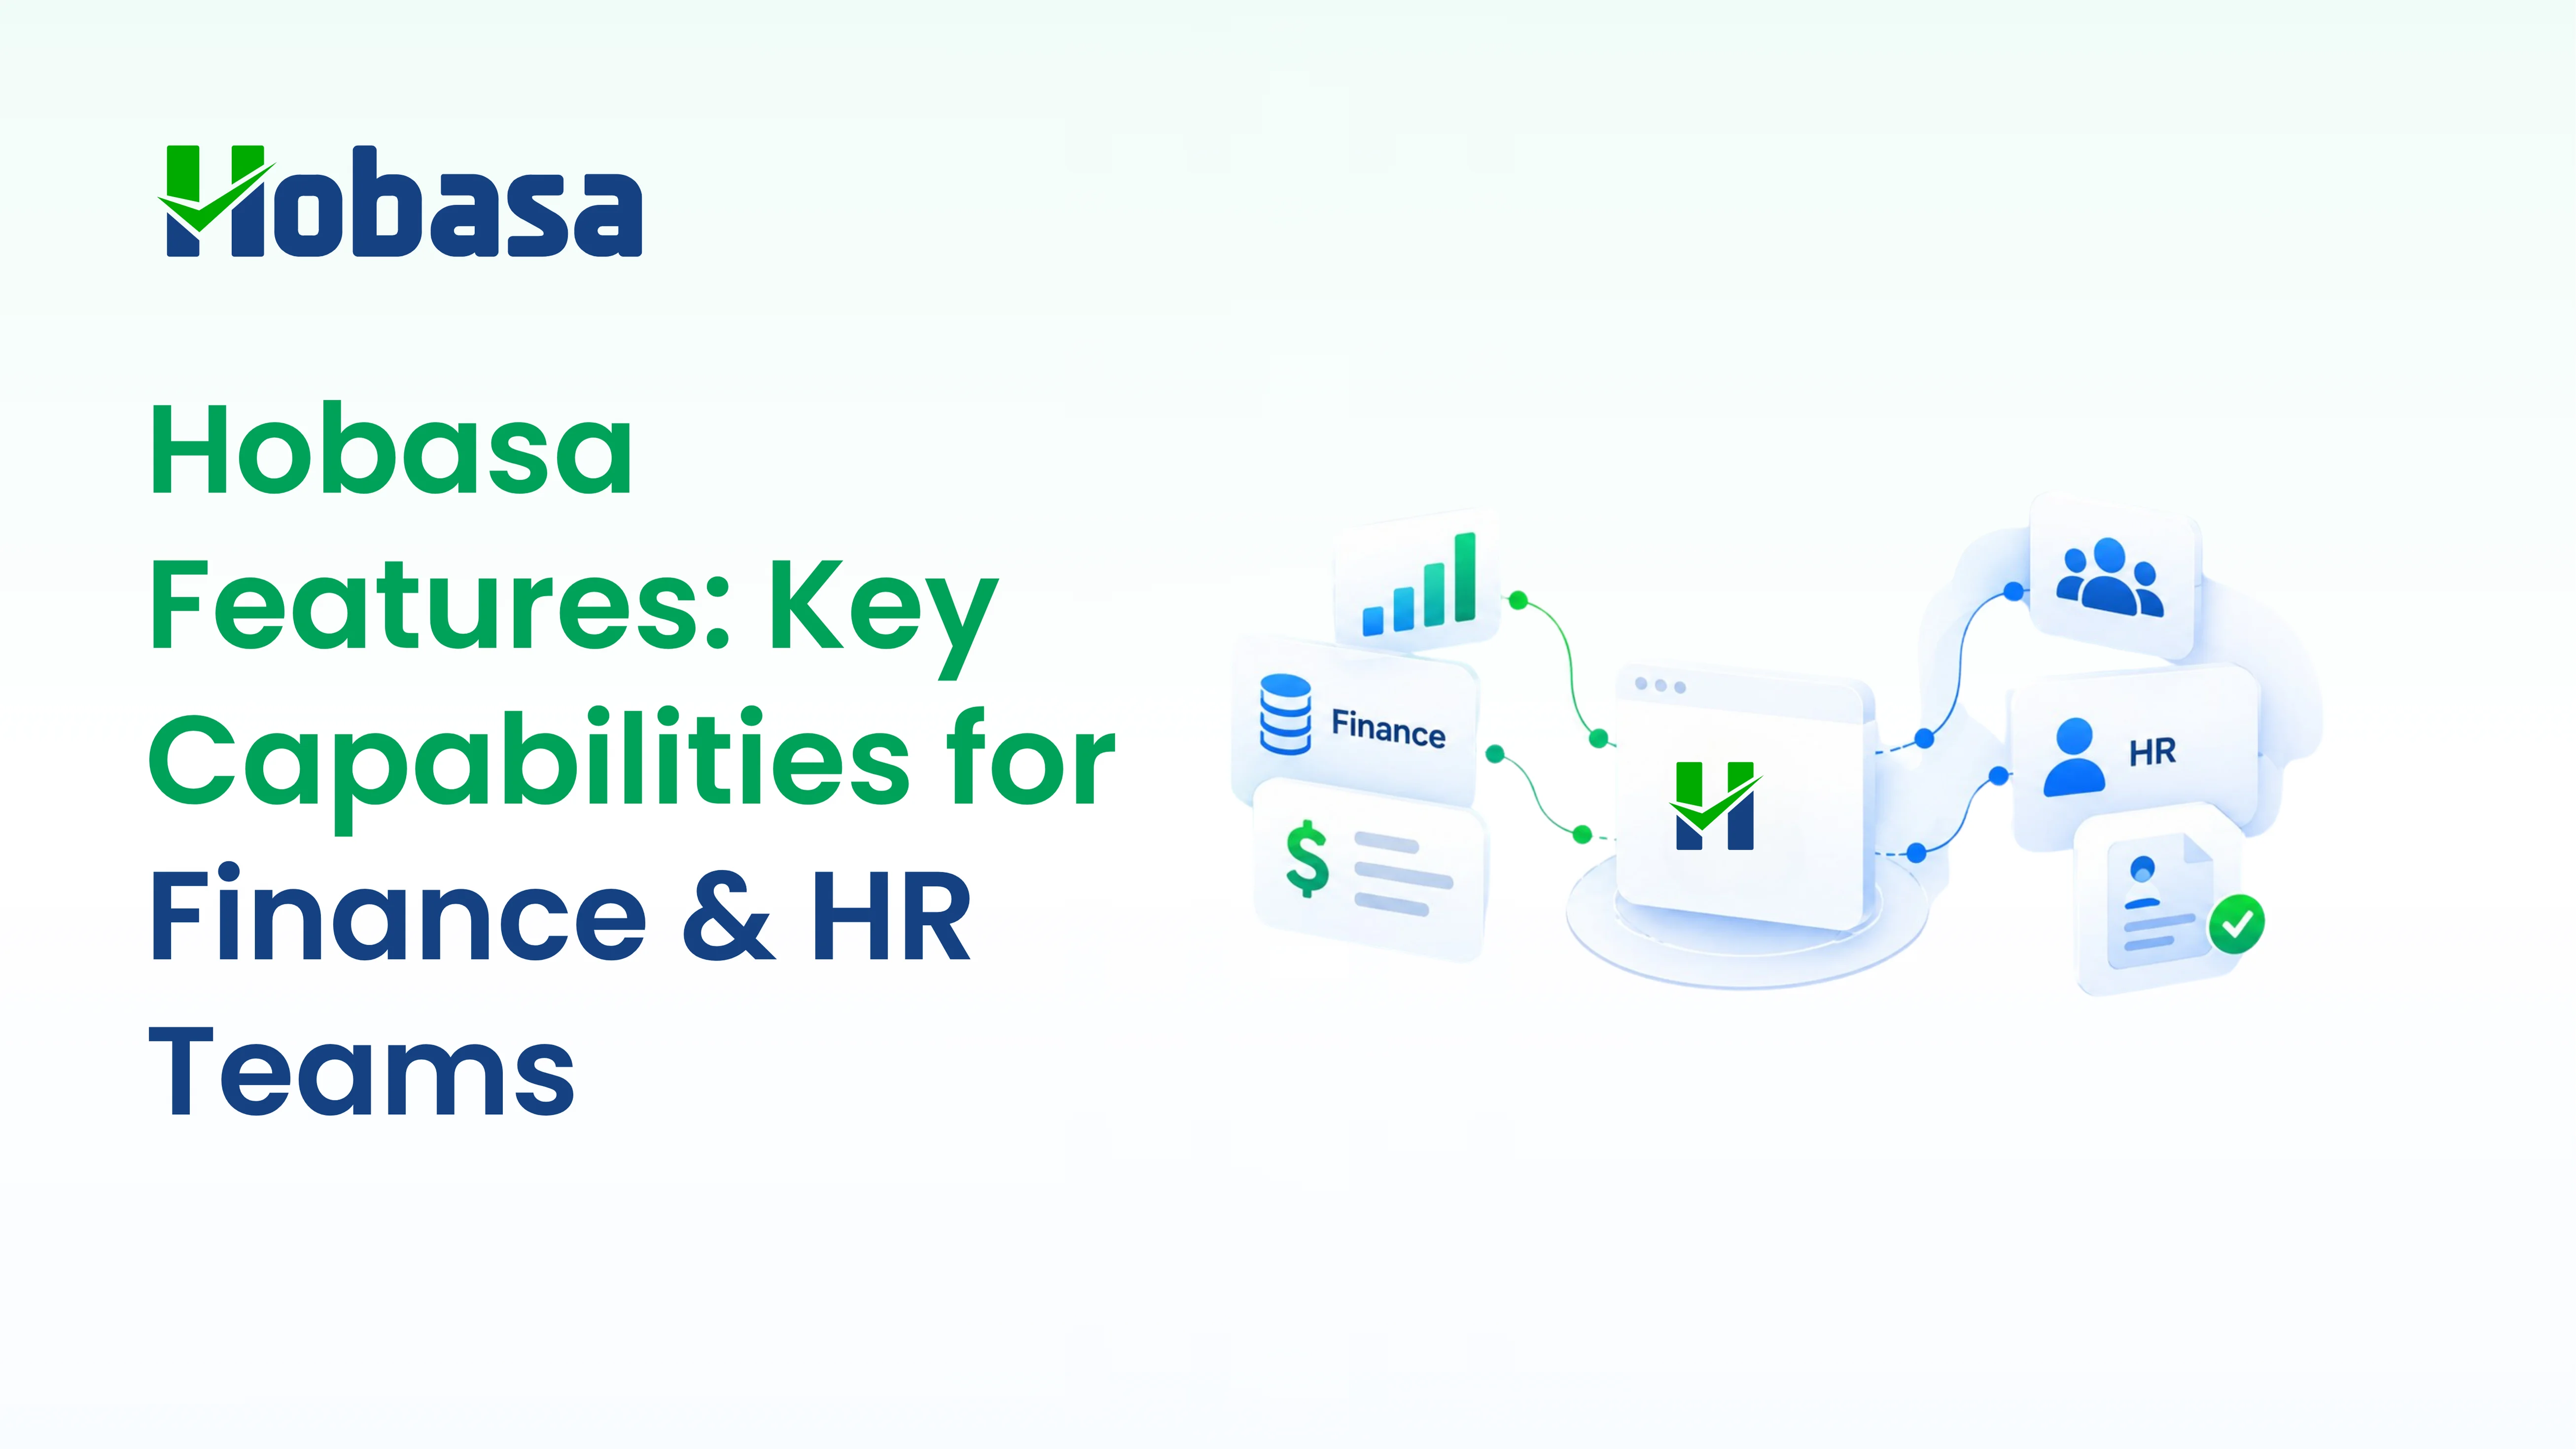
Hobasa is a cross-system intelligence platform that helps businesses connect Finance, HR, Payroll, and Operations data, looking at the relationships between systems rather than analyzing each one in isolation. Rather than replacing an ERP, payroll system, or accounting platform, Hobasa reads from the systems a business already runs, including accounting and ERP platforms such as QuickBooks, NetSuite, and Sage Intacct, and HR, payroll, and recruiting systems such as ADP, BambooHR, and Workday. It lines up related records across them, and surfaces the discrepancies, anomalies, and gaps that no single system was ever built to notice about itself.
This is directly relevant to several of the signs above. Where two systems disagree, HRIS versus payroll headcount, or budgeted versus actual labor cost in the general ledger, Hobasa is built to flag the disagreement itself as the finding, rather than quietly picking one number and moving on. Every finding is source-grounded, citing the specific record it came from, and reviewed by a person before it reaches a decision-maker, consistent with Hobasa's stated AI-assisted, human-reviewed approach.
This does not replace the operational discipline of good approval processes and clean data entry. It does shorten the distance between a gap forming and someone actually noticing it, which is where most revenue leakage quietly accumulates.
Conclusion
A business does not usually lose money between systems through one large, obvious failure. Business revenue leakage happens through the accumulation of small gaps, a discount here, a mismatch there, a report that took two weeks longer than it should have to explain a number, none of which look urgent on their own. The businesses that catch this early are not the ones with the fewest systems. They're the ones that actually compare what those systems say, before the gap between them has had months to compound.
Find the gaps between your business systems.
Connect Finance, HR, Payroll, and Operations data to surface discrepancies, anomalies, and revenue leakage that individual systems may not show on their own.
FAQs
Business revenue leakage is money a business has already earned through delivered goods or services but fails to fully collect or record, typically because of gaps between systems, manual processes, or inconsistent data rather than a single obvious mistake.
Revenue leakage is usually caused by disconnected systems, manual reconciliation processes, delayed or inconsistent data, missing approval controls, and billing or pricing errors that go unnoticed at the handoff points between departments.
Identify revenue leakage by comparing what different systems report about the same transaction or record, such as CRM deals versus billing invoices, or HRIS headcount versus payroll headcount, and tracking the variance as a recurring metric rather than a one-time audit.
Disconnected systems allow small errors, a missed invoice, an unapproved discount, a payroll mismatch, to go unnoticed for weeks or months. Individually minor, these gaps compound over time and can represent several percentage points of earnings, according to a rule of thumb reported by NetSuite.
Common signs include manual reconciliation habits, systems showing conflicting numbers, invoices that don't match closed deals, unnoticed discounts or pricing errors, and leadership needing days or weeks to explain why a financial number changed.
Businesses can reduce revenue leakage by connecting systems that are supposed to agree, automating repetitive reconciliation, monitoring key metrics continuously rather than only at month-end, and giving someone clear ownership of noticing when a metric moves.
Data silos force leadership to make decisions based on whichever partial view of the business happens to be visible at the time, often without realizing a choice between incomplete pictures is being made, which leads to decisions that looked reasonable but missed important context.
Continuous monitoring means tracking variance between systems, such as headcount, revenue, or cost figures, as an ongoing metric rather than a periodic audit, so a discrepancy is flagged when it first appears instead of being discovered weeks or months later at close.