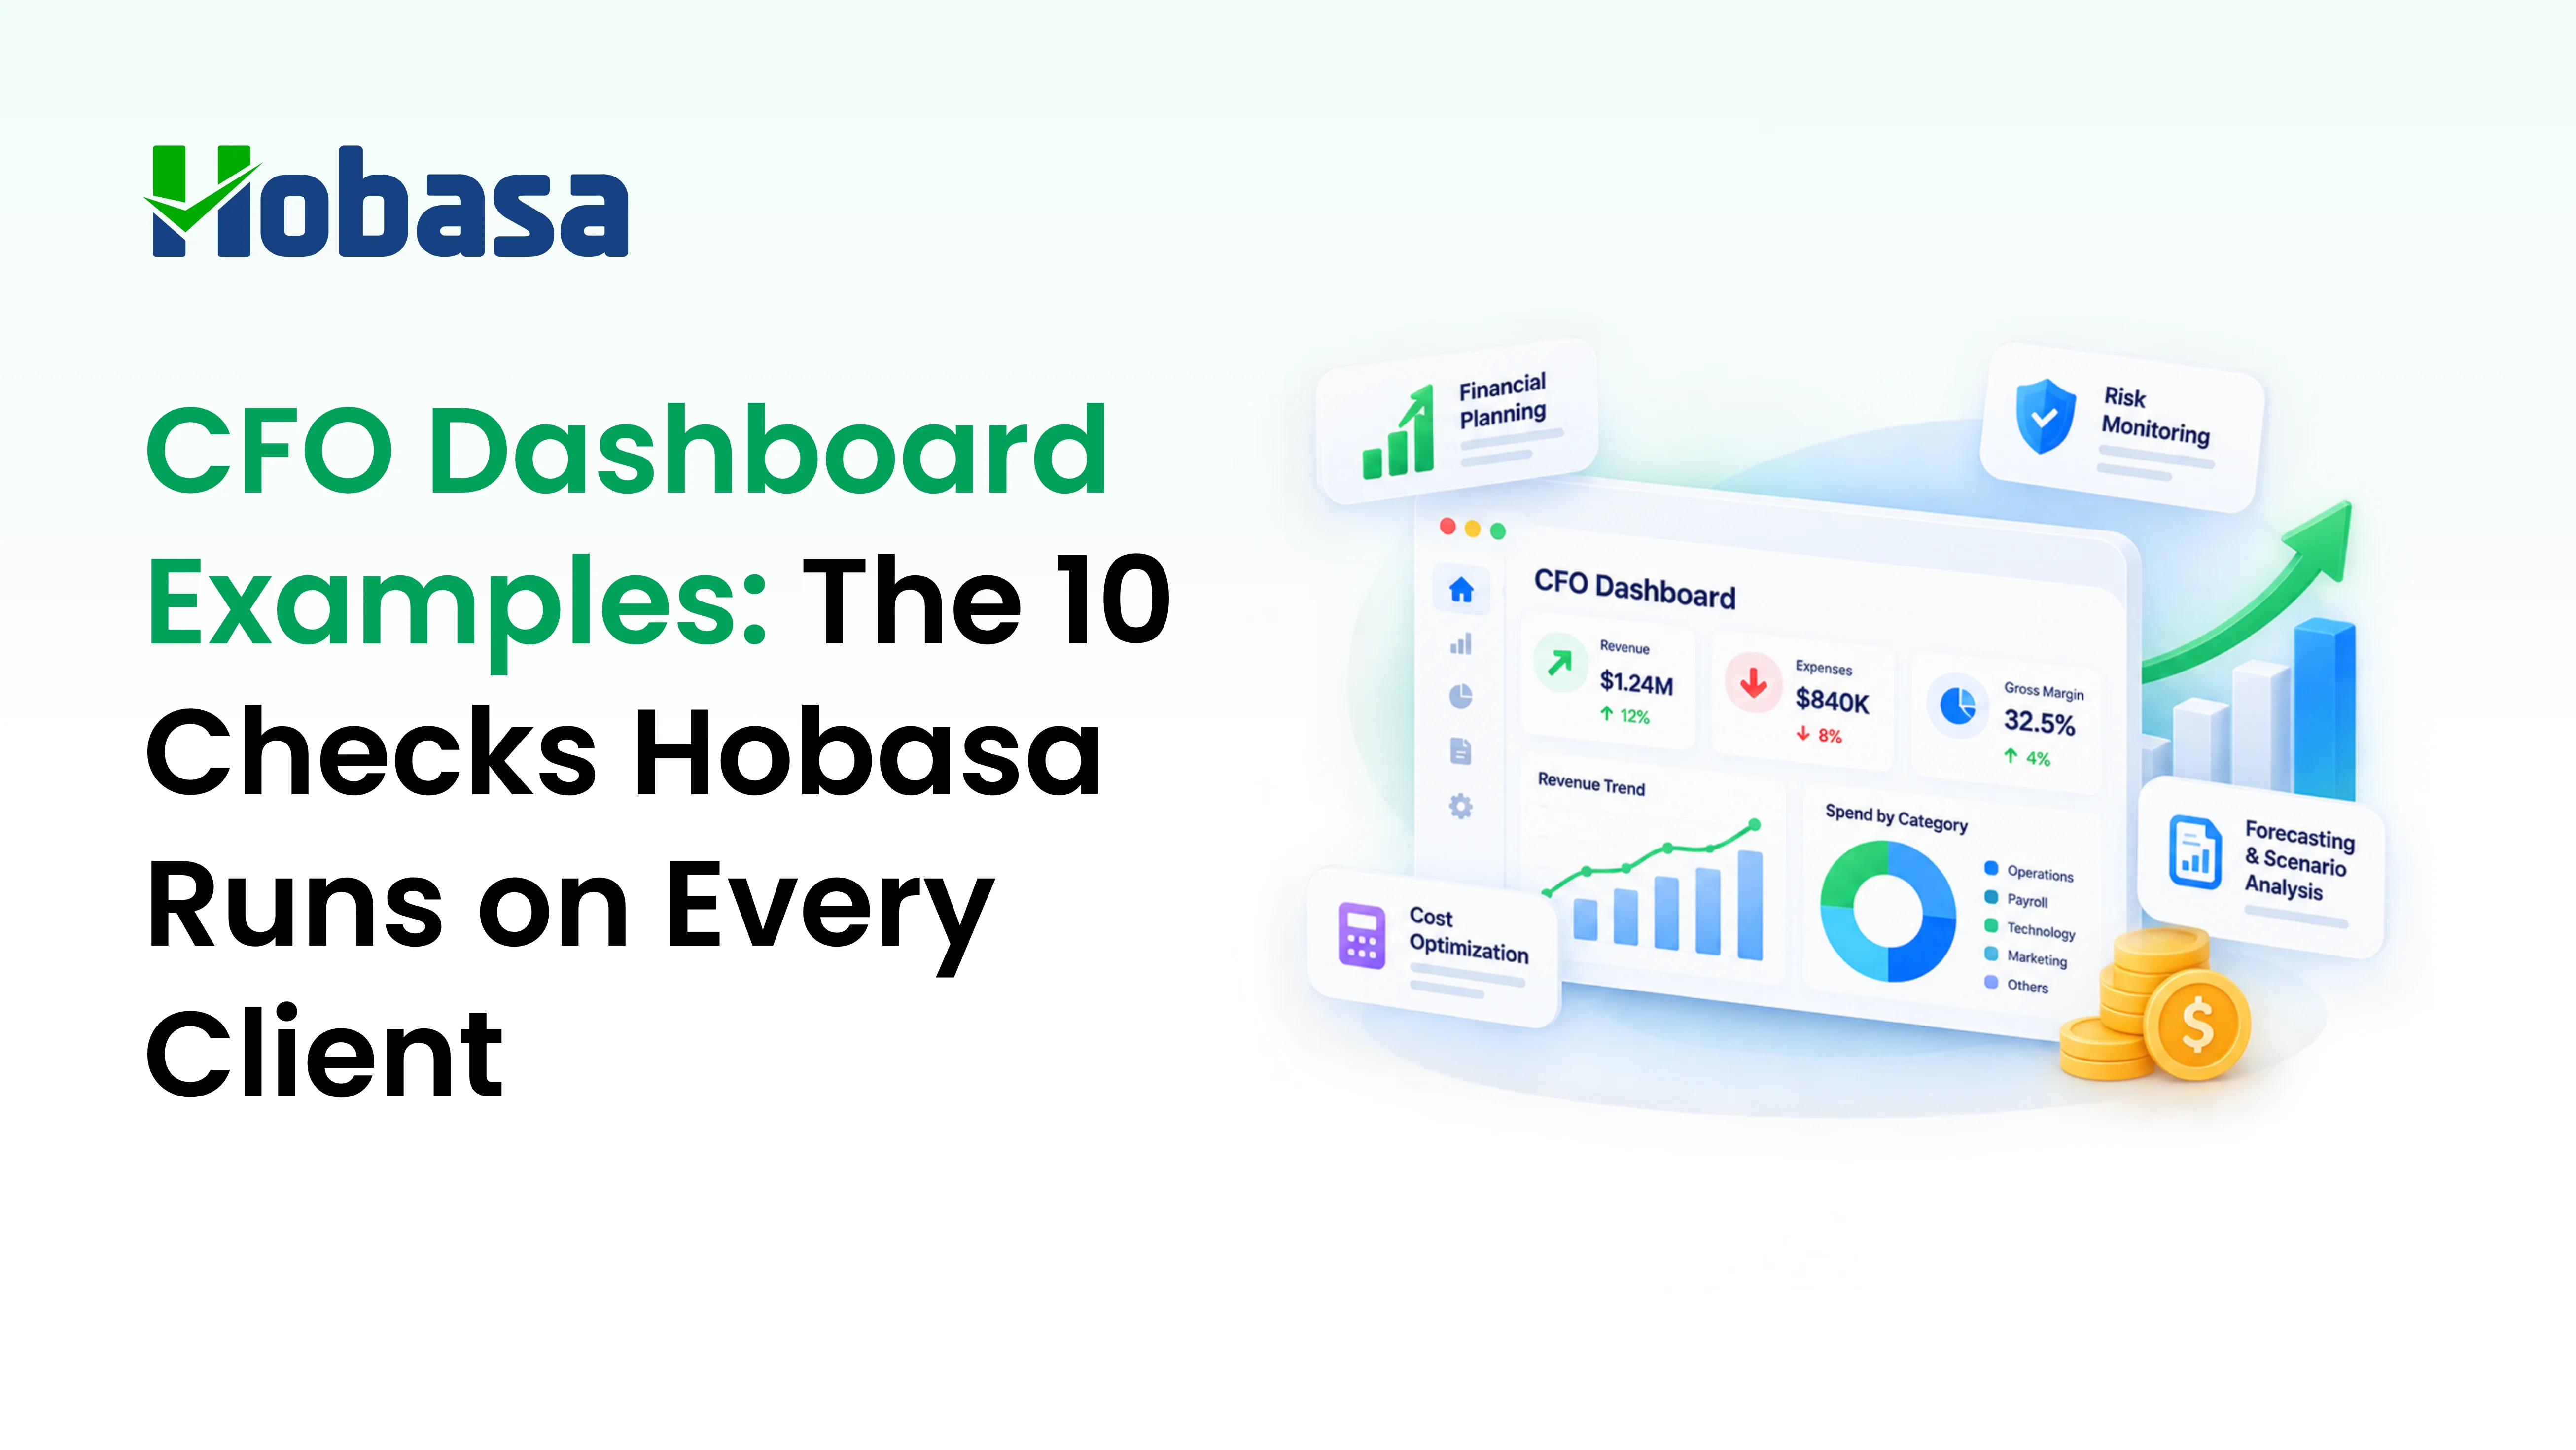
- Most CFO dashboard examples online are built for one company. A fractional CFO has ten, each with its own systems and chart of accounts, and needs the same questions answered for all of them.
- This is the list of 10 checks Hobasa runs on every client, every month: what each pulls from, and the question it actually answers.
- Six checks form the KPI layer. Four form the reconciliation and anomaly detection layer, which is where the findings a client actually remembers tend to come from.
- These checks read from existing systems. They do not forecast, budget, or write anything back to the ledger.
- Below: all 10 checks, what they deliberately do not do, and how to run them across a full client list without the prep work eating the week.
CFO dashboard examples are everywhere, and almost all of them were designed for a finance team sitting inside one company. A fractional CFO has a different problem. Ten clients, ten charts of accounts, and one afternoon to review them all before the calls start.
This is the list of 10 checks Hobasa runs on every client, every month. For each one: what it pulls from, and the question it actually answers.
Why Most CFO Dashboard Examples Fall Apart in a Fractional Practice
Search for financial dashboard examples and you will find hundreds of them. They are not wrong. They are just built on assumptions a multi-client practice breaks immediately.
They assume one company. One entity, one close calendar, one definition of revenue.
They assume a clean chart of accounts. Your third client renamed half their expense categories last quarter and told nobody.
They show a number, not a cause. A revenue line dropped 9%. The dashboard stops there. You still have to go find out why.
They refresh at month-end. Which means the issue you spot was already true three weeks ago.
They live in one client's stack. Client four uses NetSuite and Gusto, client seven uses QuickBooks and ADP. A dashboard built inside one of them is useless for the other.
A fractional CFO does not need a prettier chart. You need the same 10 questions answered for every client, in the same shape, before you open the first call.
See the same 10 checks run on a real client's data. Book a walkthrough with Hobasa and bring one client's systems. We'll show what the checks below actually surface.
The 10 Checks at a Glance
| # | Check | Pulls from | Question it answers |
|---|---|---|---|
| 1 | Revenue Leakage % | Accounting, billing | Where is earned revenue quietly disappearing? |
| 2 | Expense-to-Revenue Ratio | Accounting | How much of each dollar goes to running the business? |
| 3 | Cash Conversion Ratio | AR, AP, bank | How fast does revenue become usable cash? |
| 4 | Revenue Realization Rate | Bookings, collections | How much booked revenue actually arrives? |
| 5 | Profit Velocity Index | Accounting, multi-period | Is profitability speeding up or slowing down? |
| 6 | Operating Profit Margin | Accounting | Is the core business profitable before financing? |
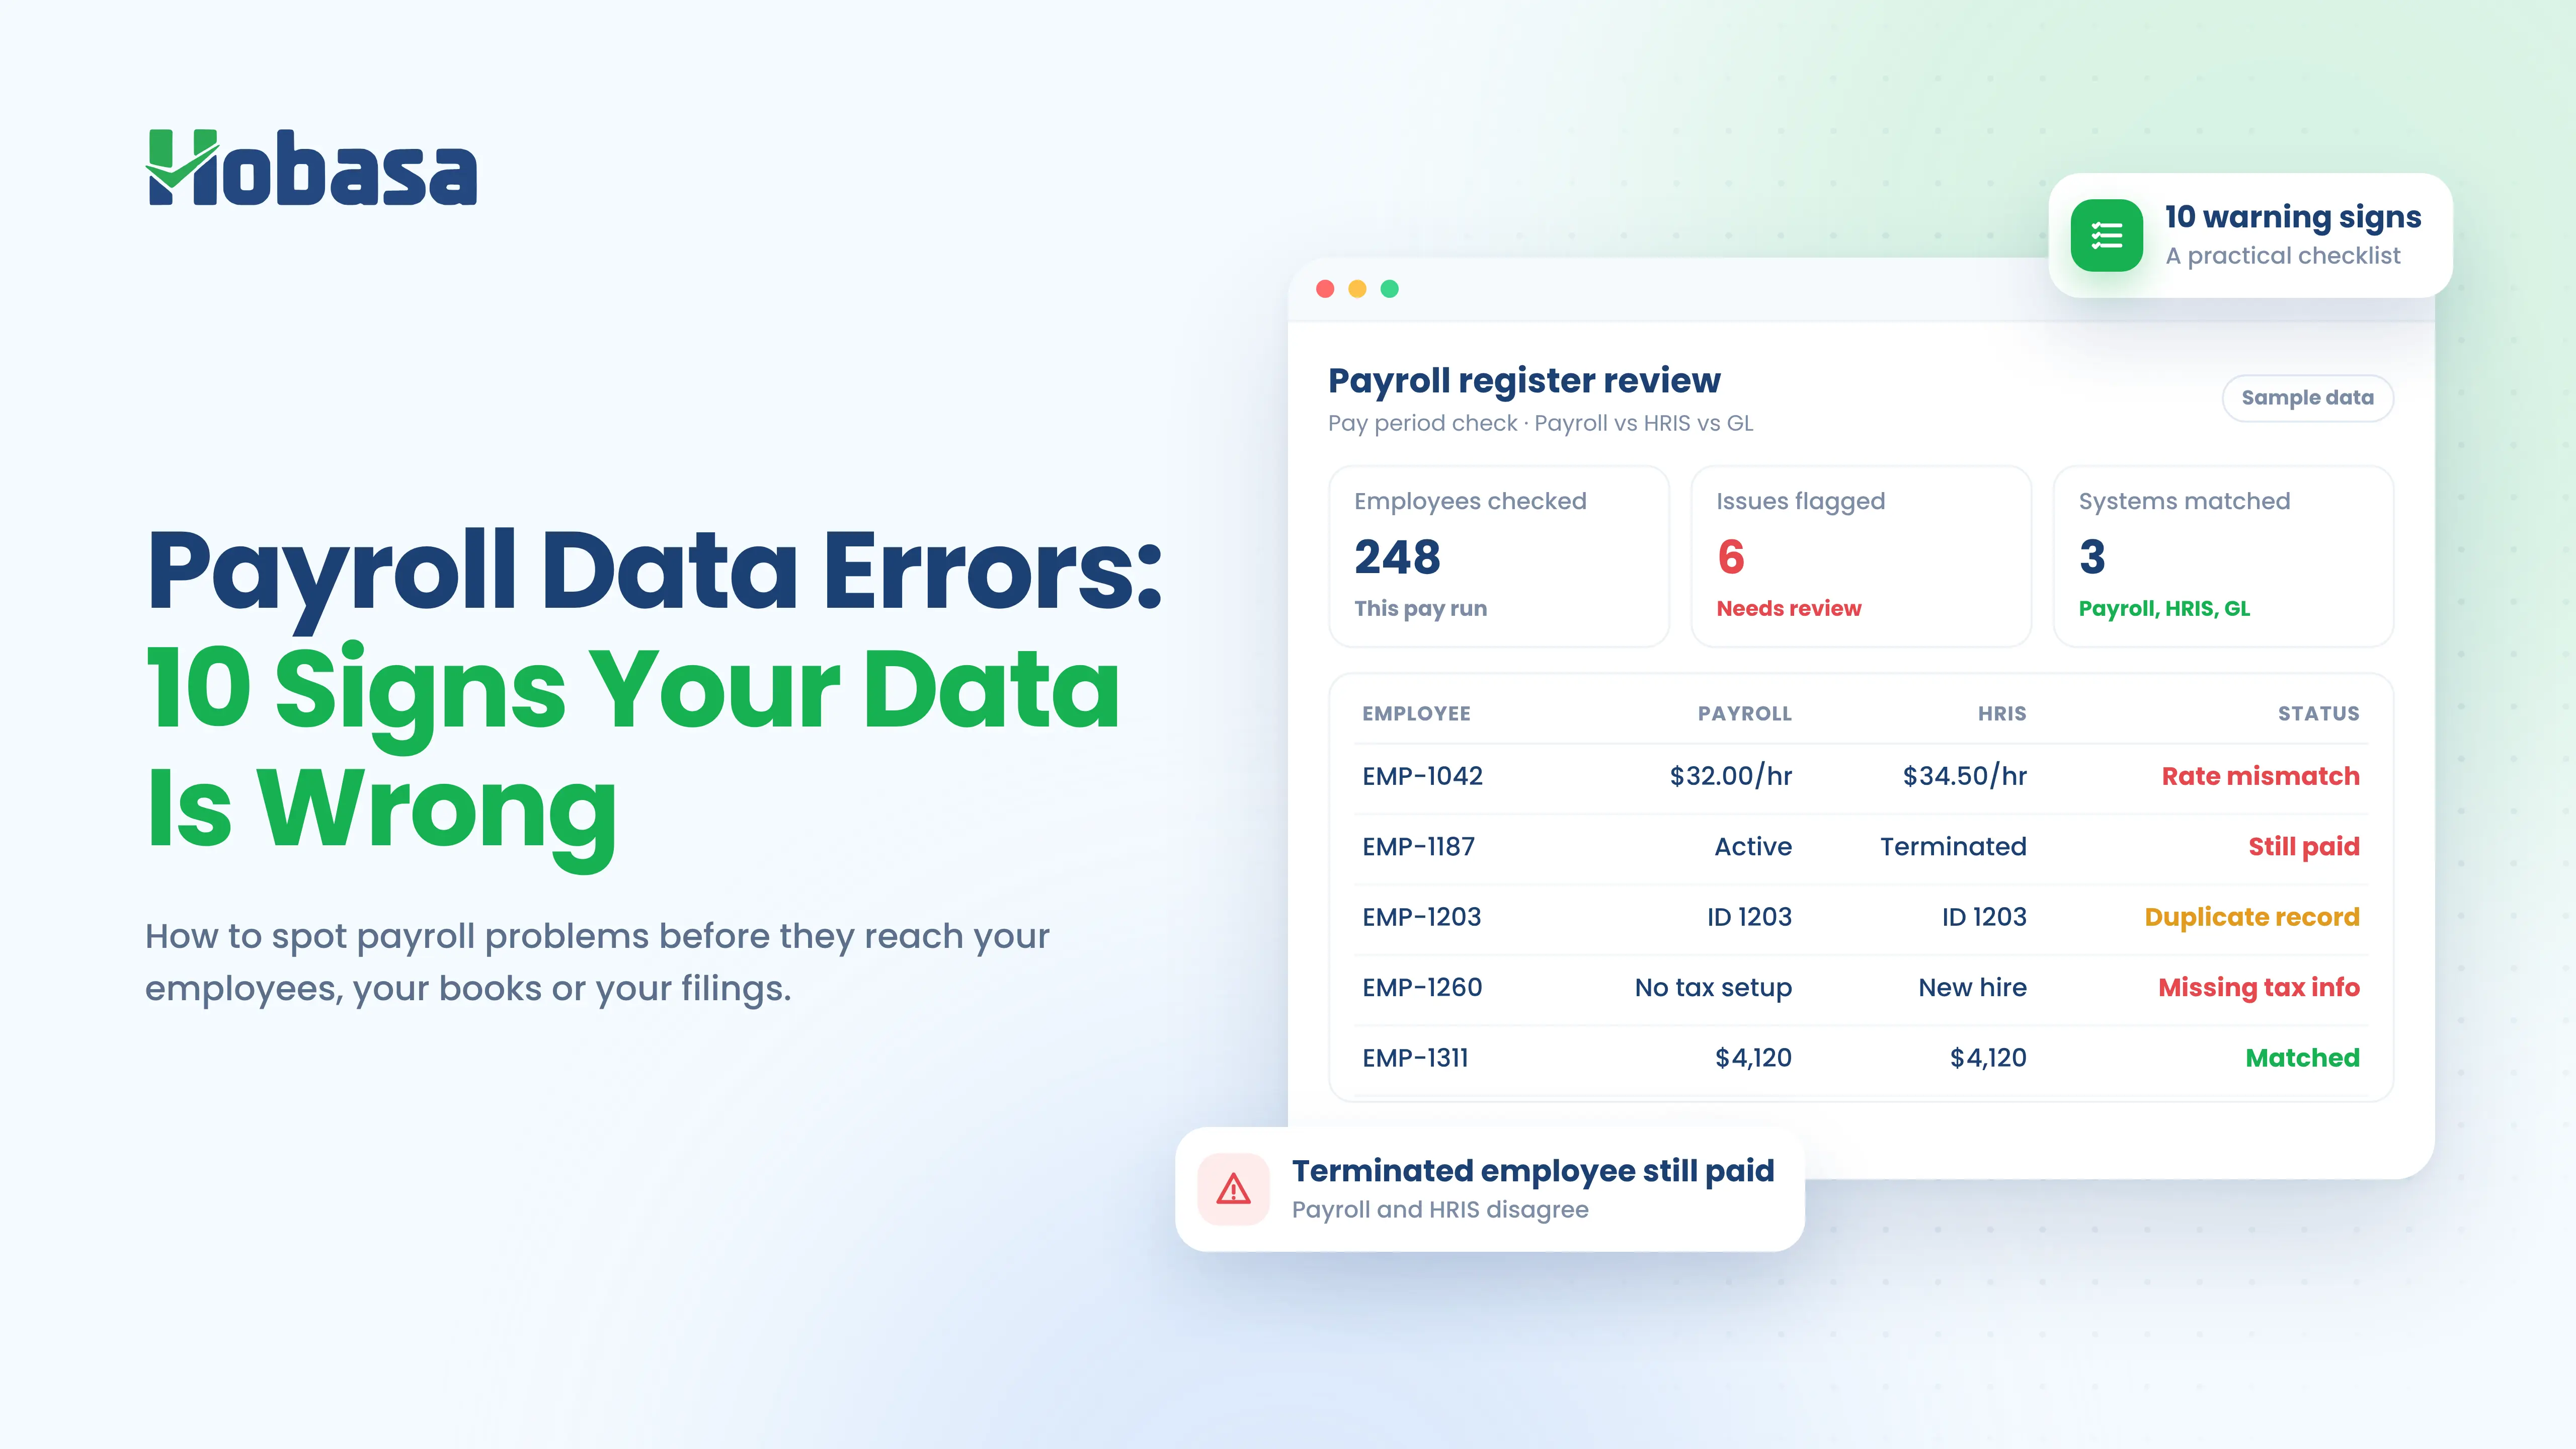
| 7 | Payroll to GL variance | Payroll, general ledger | Do payroll and the books agree? |
| 8 | AR ageing and payment timing | AR, bank | Which customers are drifting? |
| 9 | Vendor spend by period | AP, GL | What changed in spend, and with whom? |
| 10 | Duplicate payment exceptions | AP, GL | Did we pay the same thing twice? |
Checks 1 to 6 are the KPI layer. Checks 7 to 10 are the reconciliation and anomaly detection layer, and in practice that is where the uncomfortable findings come from.
Most CFO dashboards stop after the first six. The second four are the reason a client keeps the retainer.
Want these checks running across every client?
Hobasa helps fractional CFOs spot leakage, cash gaps, and payroll variances before the monthly scramble.
Talk to our teamChecks 1 to 6: The KPI Layer
Each of these arrives with a written summary, the observations behind it, the risks it raises, and a suggested next step. A number on its own does not survive a client conversation.
1. Revenue Leakage %
Revenue that slips away through billing gaps, unapplied payments, and discounts nobody approved.
This is usually the first check that pays for itself, because leakage rarely shows up as a problem. It shows up as revenue that was simply never invoiced.
Watch for: work delivered but not billed, credits applied without approval, and payments received but never matched to an invoice.
We wrote about this in more detail in Detecting and Preventing Financial Leakage: How to Plug the Gaps.
2. Expense-to-Revenue Ratio
How much of every dollar earned is consumed by operating cost, tracked across periods rather than at a single point.
One month tells you almost nothing. Six months tells you whether the client's cost base is growing faster than the revenue paying for it.
3. Cash Conversion Ratio
Cash and receivables measured against payables, so you can see how quickly earned revenue turns into money the client can actually spend.
Why it matters for advisory: a client can be profitable on paper and still be unable to make payroll. This is the check that separates those two conversations.
4. Revenue Realization Rate
The share of booked revenue that gets collected.
This is where optimistic reporting usually falls apart. A strong bookings month followed by a weak realization rate is a collections problem wearing a sales costume.
5. Profit Velocity Index
The direction and speed of net income across periods.
A single bad month is noise. Three months of decelerating profit is a trend, and it is far easier to raise with a client while it is still a trend.
6. Operating Profit Margin
Core profitability after operating expenses, before interest and tax.
Standard, and worth including precisely because it is standard. It is the number a client's board already knows how to read.
Checks 7 to 10: The Reconciliation Layer
These four are where a fractional CFO earns the retainer. They compare two systems that were never built to agree with each other.
7. Payroll to General Ledger Variance
Payroll registers compared against the payroll expense recorded in accounting, period by period, with the variance itemized rather than totalled.
Payroll is usually a client's largest single cost and the one most likely to be posted inconsistently. A variance here is either a mapping problem or a real cost the books have not caught.
Common causes:
Bonuses or commissions posted to the wrong period
Employer taxes split across accounts inconsistently
Contractor payments running through payroll but coded as an expense
A mid-month pay run that never made it into the close
8. AR Ageing and Payment Timing
Receivables ageing read alongside actual payment behavior from the bank.
Ageing buckets alone hide the useful signal. A customer who always pays on day 47 is predictable. A customer who used to pay on day 30 and now pays on day 52 is telling you something, and it is worth a conversation before it becomes a write-off.
9. Vendor Spend by Period
Spend compared across periods and grouped by vendor, so a movement has a name attached to it.
A variance report says spend rose. This says which vendor, in which month, and by how much. Those are two very different starting points for a client call.
10. Duplicate Payment Exceptions
Payments checked against defined duplicate criteria across the AP subledger and the GL.
The rules here are deterministic. An invoice either meets the duplicate criteria or it does not. That matters, because a finding you are about to put in front of a client's board has to survive the question "how did you calculate that."
In practice: a client's October vendor spend came in $42,180 above September, an 18% jump. The variance report showed the number. Two invoices from the same logistics vendor were then flagged as probable duplicates of bills already paid in September, with the October bill, the matching September bill, and the two AP ledger rows all cited.
That is the gap between a variance table and a finding. One tells you a number moved. The other tells you what to raise on Monday.
Illustrative example. Company names and figures are fictional.
Want to see what a finding like this looks like on your own client list? Talk to the Hobasa team and bring your messiest client. That is usually the fastest way to see the reconciliation layer earn its place.
KPI charts are not enough. Reconciliation is.
See how Hobasa layers reconciliation checks on top of the numbers your clients already produce.
Get in touchWhat These Checks Deliberately Do Not Do
Worth being clear, because plenty of dashboard tools blur this line.
| These checks do | These checks do not |
|---|---|
| Read from your clients' systems of record | Write any entry back to the ledger |
| Compare what two systems actually recorded | Forecast, budget, or project forward |
| Flag movement that breaks an established pattern | Replace your planning or BI tool |
| Cite the row or document behind every finding | Do your clients' bookkeeping |
Every check above runs on data that already exists. None of it is a projection. If you need forecasting and scenario modeling, that is a different category of tool and you should keep using it. Hobasa sits underneath, making sure the numbers feeding it agree with each other.
Hobasa is also not accounting software, payroll software, or an HRIS. It reads from all three.
Running This Across Your Whole Client List
The checks themselves are not the hard part. Any competent fractional CFO could build most of them by hand for one client. The problem is doing it for nine clients, every month, without the preparation work eating the week.
Three things have to be true for that to work:
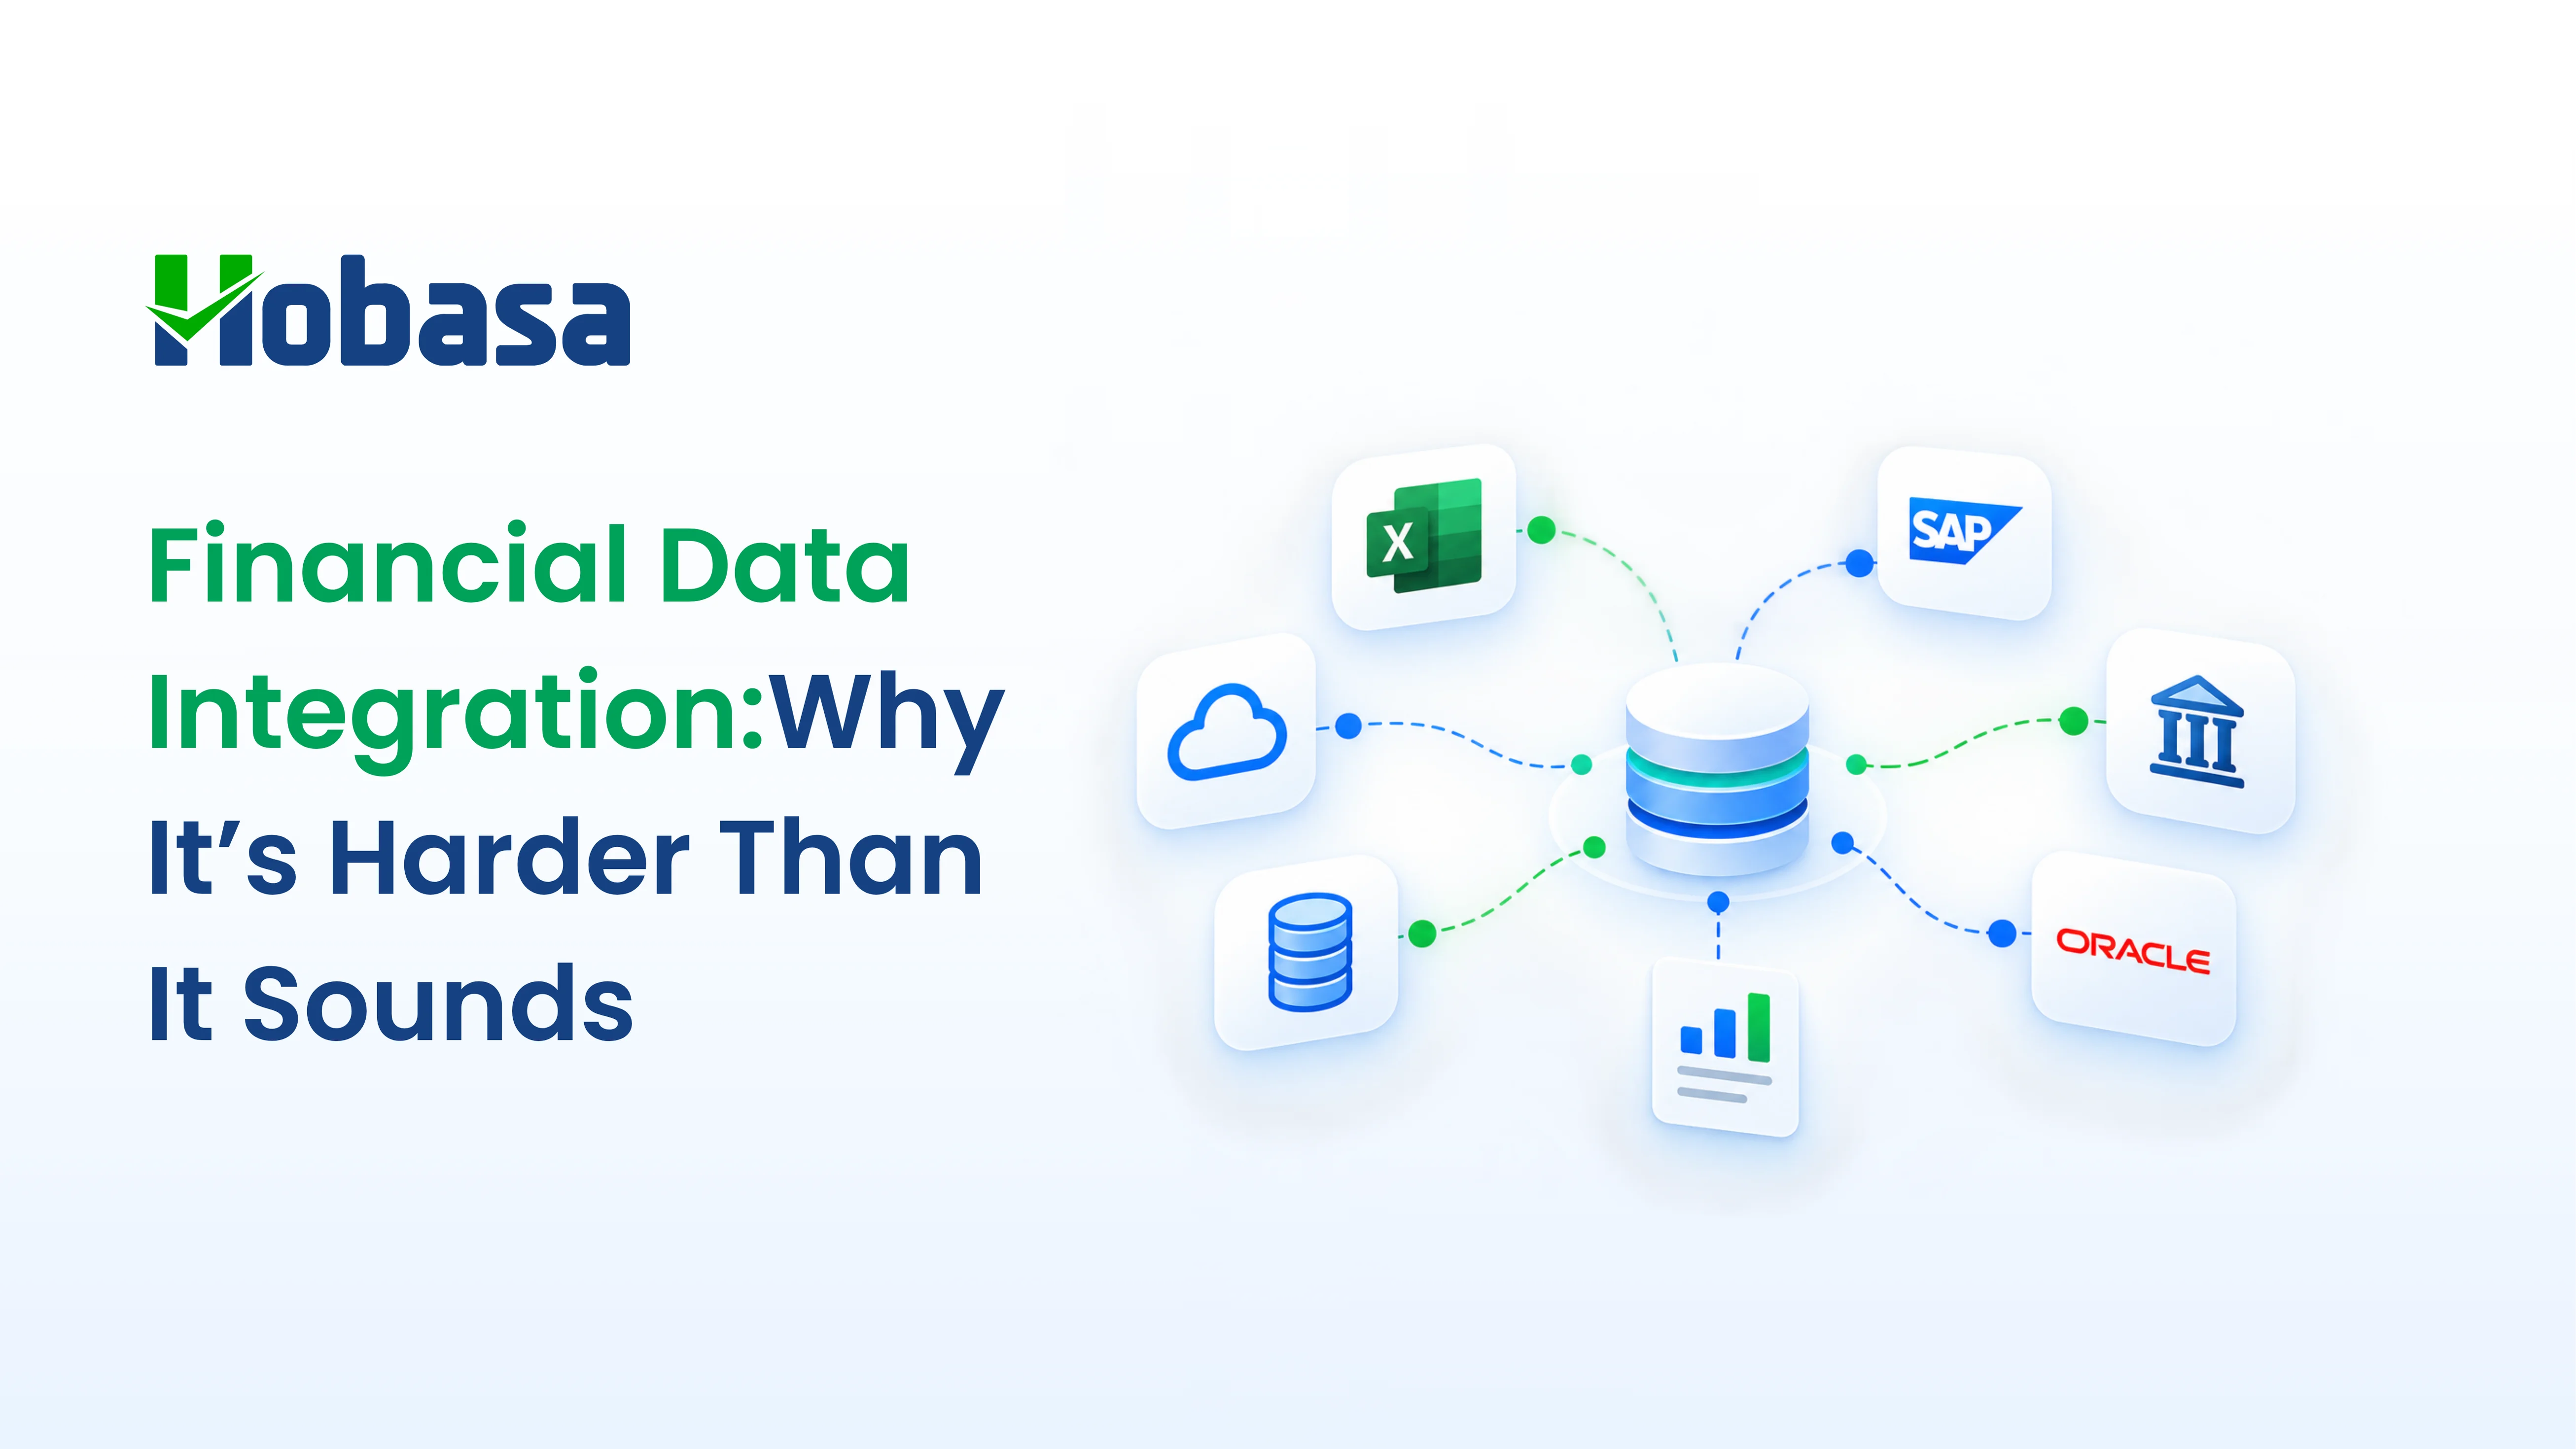
Every client's systems are connected
Every client's systems are connected, including the ones with no clean export.
Every client is mapped to the same model
Every client is mapped to the same model, so check 7 looks the same whether the client runs Gusto or ADP.
The checks run between reviews
The checks run between reviews, not just when you sit down to prepare.
That is the job Hobasa does. Findings are also reviewed by an analyst before they reach an owner or a controller, which matters when the finding is "you paid this vendor twice."
You can see how it works on the fractional CFO platform page, or on the platform overview if you want the underlying detail. For teams running client accounting services rather than solo engagements, the CPA firm view is closer to your setup. If your clients are portfolio companies, start here instead..
The Dashboard Is Only Useful If It Tells You What to Raise
Most CFO dashboard examples are built for one company and stop at the number. A fractional practice needs the same 10 questions answered for every client, in the same shape, with the reconciliation layer included and each finding traceable to a source.
Six KPI checks tell you what moved. Four reconciliation checks tell you whether the books agree. Together they are the review you would run by hand if you had the time.
Ready to run this on your own client list? Book a demo and tell us which systems your clients run, or read more for fractional CFOs.
Run the 10 checks across your entire client list.
See how Hobasa connects client systems, runs the KPI and reconciliation layers, and surfaces the findings worth raising on your next call.
FAQs
At minimum: profitability, cost structure, cash conversion, and revenue realization. For a fractional CFO reviewing multiple clients, add a reconciliation layer comparing payroll against the general ledger and AP against the GL. The KPI layer tells you what changed. The reconciliation layer tells you whether the underlying numbers can be trusted.
Most financial dashboard examples report on one company's accounting data. CFO dashboards are built for a decision, so they pull from several systems at once, including payroll, HR, and operations, and they show the cause behind a movement rather than just the movement itself.
The KPI layer suits a monthly review cycle. The reconciliation layer works better running continuously, because a duplicate payment or a payroll mismatch caught in week two is a correction, and the same issue caught at close is an explanation.
No. They sit underneath. Your planning and BI tools model what happens next, and these checks make sure the actuals feeding them agree across systems. Different jobs.
Yes. Most advisors start with one or two engagements, usually the ones with the messiest system landscape, then expand once the review rhythm is established.