- Workforce analytics software focuses on organization-level operational data, capacity, labor cost, utilization, and productivity, which is a different emphasis than HR analytics or people analytics, both of which lean toward individual-level data.
- The category splits into two very different kinds of tools: strategic capacity and cost-planning platforms, and individual employee activity monitoring tools. They are not interchangeable, and confusing them leads to the wrong purchase.
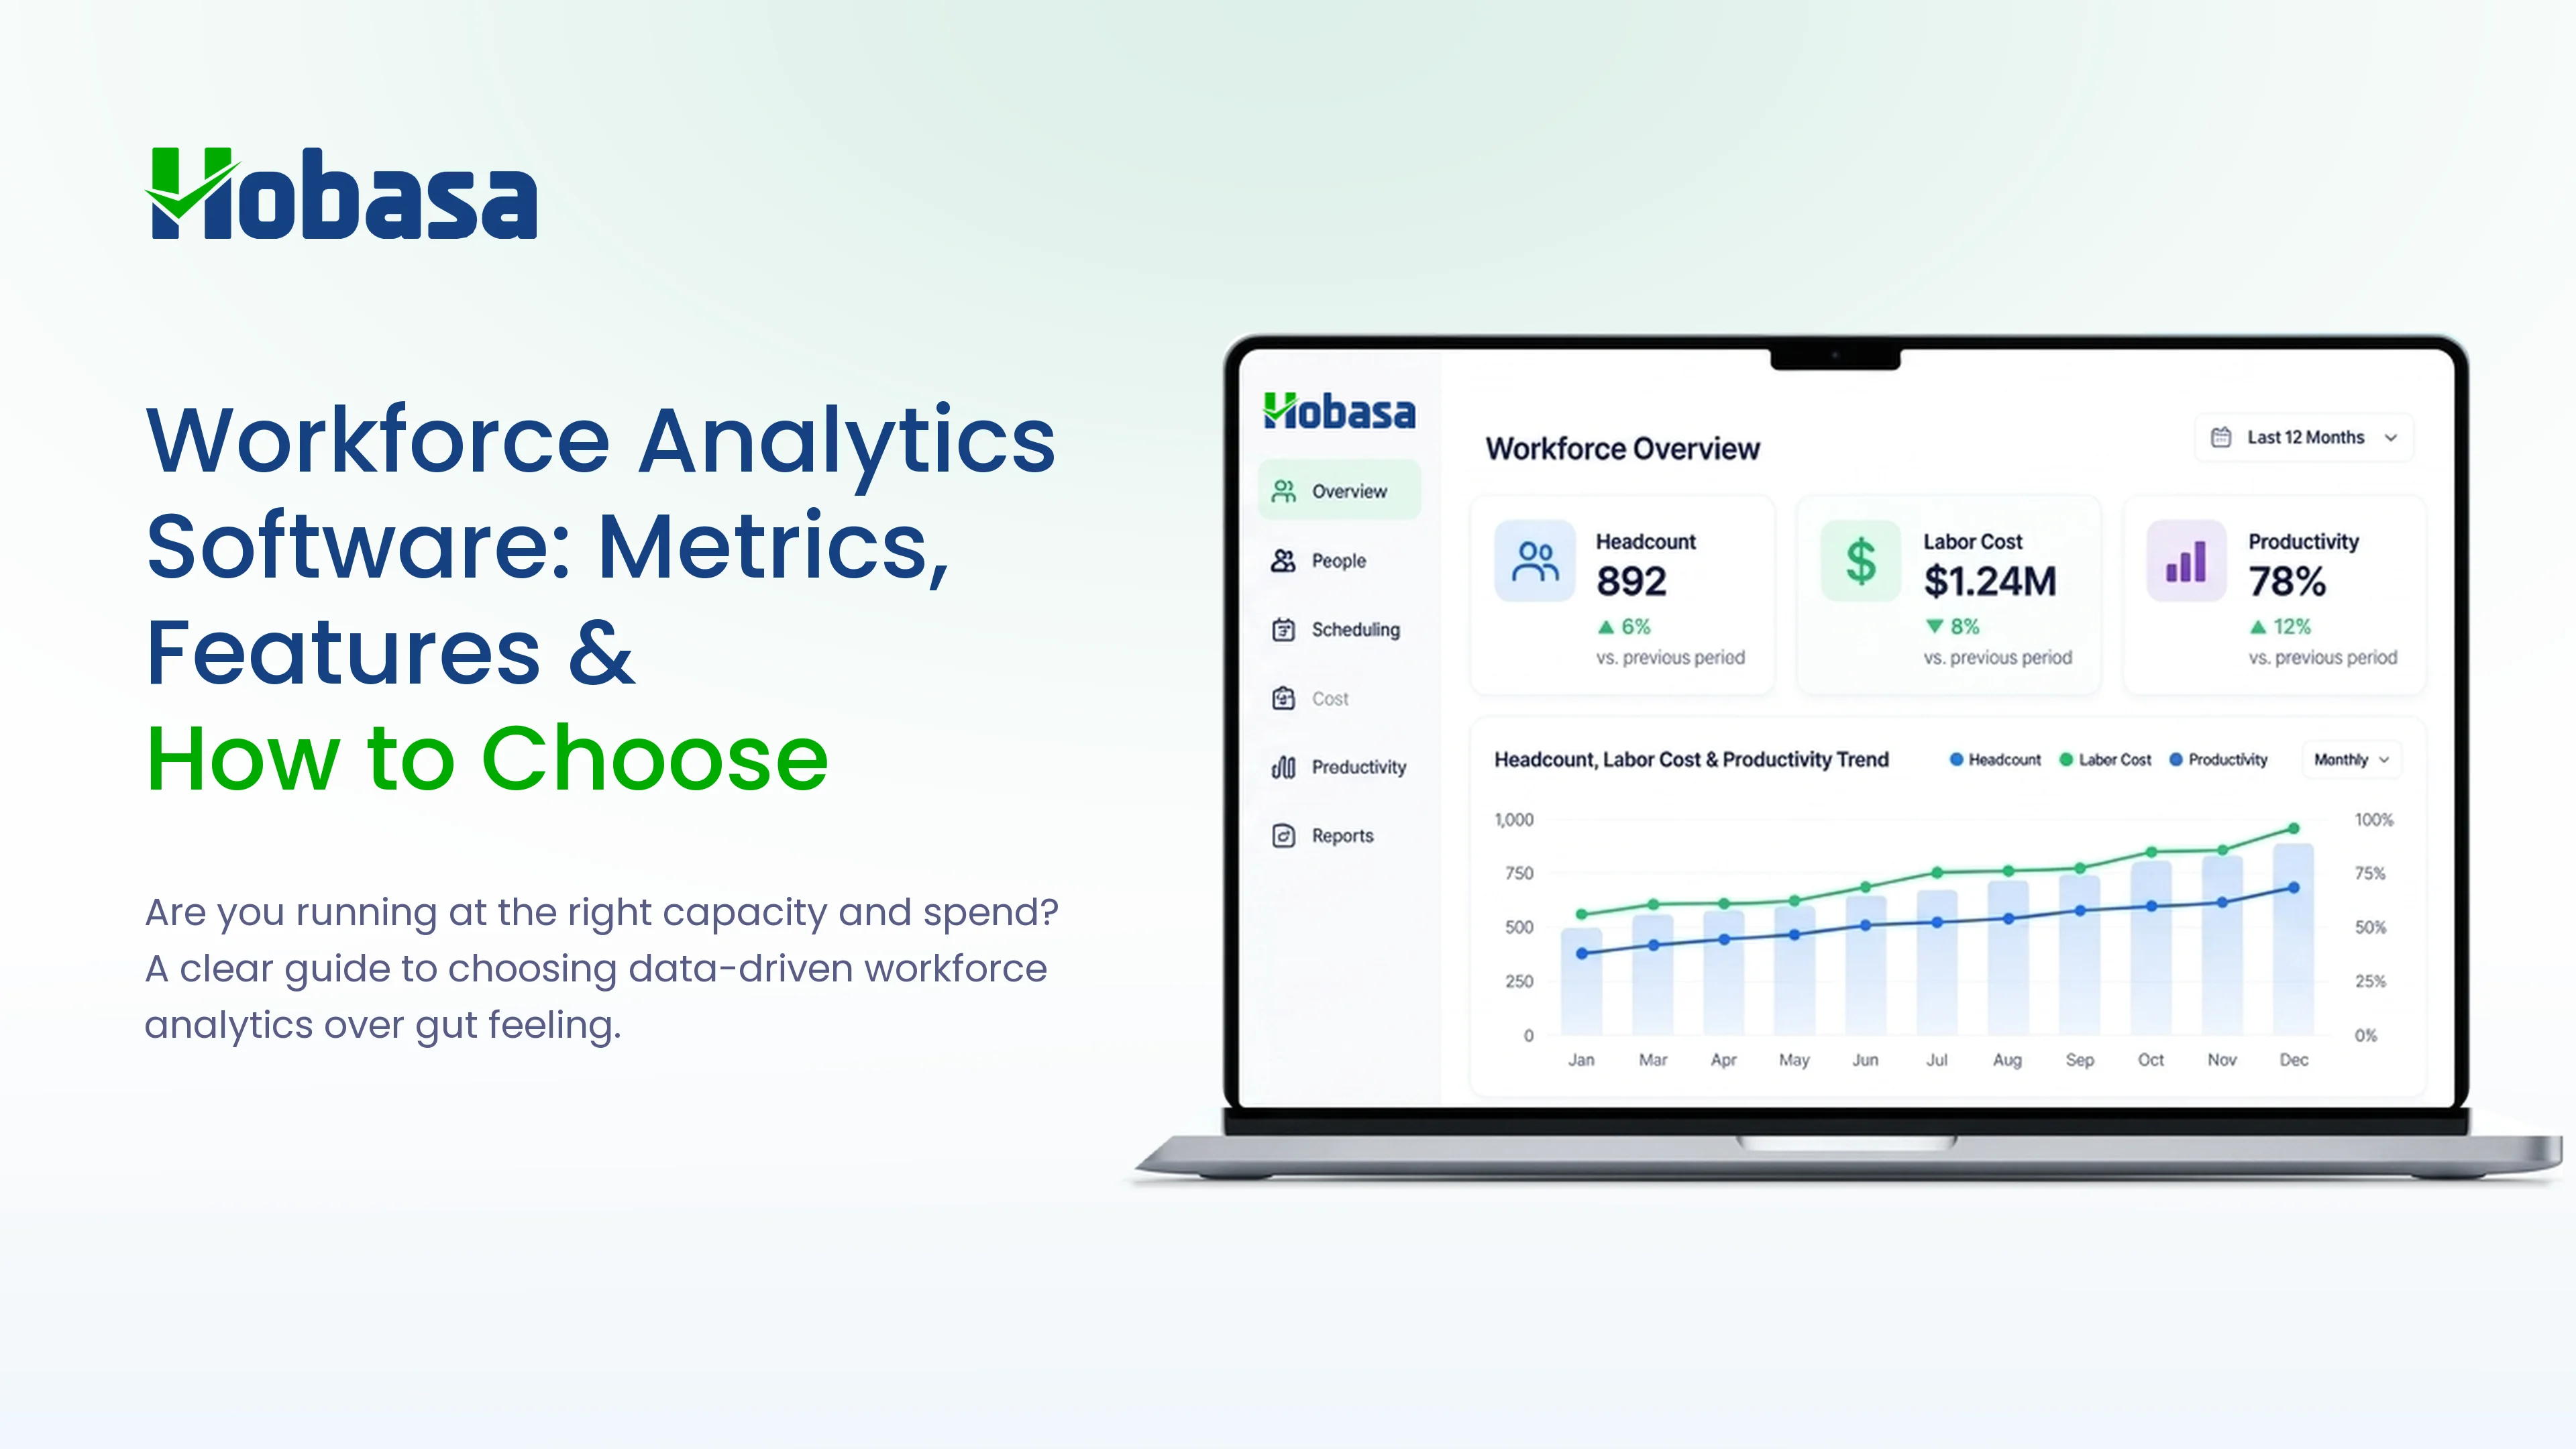
- A useful platform tracks a specific set of metrics: capacity, labor cost, utilization, productivity trends, attrition prediction, and skill coverage, not just headcount and turnover.
- Workforce data commonly breaks down because it lives in three places at once: HRIS, payroll, and scheduling or operations tools, none of which were built to reconcile with each other.
- Below: what the software should track, the features that matter in 2026, the two categories to choose between, and a practical framework for picking the right one.
What Is Workforce Analytics Software?
Workforce analytics software collects and analyzes operational workforce data, capacity, labor cost, utilization, and productivity, to help leaders plan and manage the workforce as a business resource, not just an HR record.
Where HR analytics typically tracks department-level metrics like time-to-hire and turnover, and people analytics often goes deeper into individual performance and engagement, workforce analytics is more concerned with the organization-level question: do we have the right people, in the right place, at the right cost, doing productive work. It pulls from HRIS and payroll like the others do, but it also draws heavily on scheduling, time tracking, and operational systems that HR-only tools rarely touch.
This is why workforce analytics questions tend to sound more operational than HR questions: not "why is turnover up" but "why is labor cost outpacing revenue in three regions," not "who is disengaged" but "which teams are running below capacity while others are overtime-heavy."
Workforce Analytics vs. HR Analytics vs. People Analytics
These three terms overlap heavily in marketing copy and less in what a platform actually optimizes for.
| Term | Primary lens | Typical questions |
|---|---|---|
| HR analytics | HR-department metrics | Turnover rate, time-to-fill, cost per hire |
| People analytics | Individual-level workforce signals | Engagement, performance, development, retention risk |
| Workforce analytics | Organization-level operational data | Capacity, labor cost, utilization, productivity, staffing efficiency |
In practice, most modern platforms blend all three to some degree, and vendors rarely stick to one label consistently. The distinction matters more for your evaluation than for the market's vocabulary: if the real question is "are we staffed and spending correctly," you are shopping for workforce analytics, even if half the vendors you look at call it people analytics.
For a deeper look at the individual-data side of this category, see People Analytics Software: What It Is and How to Choose One, and for a persona-specific vendor comparison, see Best HR Analytics Software for CFOs & CHROs.
Need workforce analytics that includes cost and capacity?
Hobasa reads HR, payroll, and finance together so capacity and labor spend tell one story.
Talk to our teamThe Metrics Workforce Analytics Software Should Track
A platform that only reports headcount and turnover is doing HR reporting, not workforce analytics. The organization-level metrics that actually distinguish this category:
1. Capacity utilization: how much of available working capacity is actually being used, and where it is sitting idle or overloaded. A team running at 60% utilization and one running at 130% are both signals, just opposite ones.
2. Labor cost as a share of revenue or output: whether workforce spend is scaling appropriately with the business, not just whether it is going up in absolute terms.
3. Productivity trends: output per employee or per team over time, tracked as a trend rather than a single snapshot that tells you almost nothing on its own.
4. Attrition prediction: a forward-looking view of likely departures, not just a historical turnover rate that only confirms what already happened.
5. Capacity forecasting: projected staffing needs based on demand, seasonality, or growth plans, so hiring and scheduling decisions get made ahead of the gap, not after it.
6. Skill coverage: whether the skills a team needs are actually present, not just whether headcount is filled on paper.
7. Manager effectiveness signals: patterns in retention, engagement, and output that vary meaningfully by manager, since two teams with identical headcount can perform very differently depending on who runs them.
8. DEI representation metrics: workforce composition tracked over time against stated goals, where relevant to the organization.
Real-time data matters more in this category than in HR reporting generally, because capacity and cost problems compound quickly. A staffing imbalance caught in week two is a scheduling fix. The same imbalance caught at quarter-end is a budget miss already booked.
Core Features to Look For in 2026
By 2026, a specific set of capabilities has become close to table stakes rather than a differentiator:
1. Data integration across HRIS, payroll, scheduling, and time tracking, not just one system. A tool that only reads the HRIS will always be blind to the payroll and scheduling side of the same question.
2. Real-time or near-real-time dashboards, since capacity and cost issues lose most of their value if they surface a month late, after the budget has already absorbed the miss.
3. Predictive modeling for attrition and capacity, using historical patterns to project forward rather than only reporting what already happened.
4. Anomaly detection, flagging unusual labor cost, overtime, or capacity patterns automatically instead of waiting for someone to notice a chart looks off.
5. Configurable, role-based dashboards, since a CFO, a CHRO, and an operations lead need different views of the same underlying data, not three separate tools.
6. Governed, aggregate-level reporting, with individual data access limited to direct managers and the employee themselves, and executive views showing aggregate patterns rather than named individuals.
That last point deserves more attention than it usually gets. Workforce analytics produces sensitive data, and the responsible platforms build access controls around that from the start rather than treating it as an afterthought bolted on after a data incident.
Two Very Different Categories Hiding Under One Label
Before comparing features, it's worth being direct about something buyers often discover too late: "workforce analytics software" describes two genuinely different products.
Strategic capacity and cost-planning platforms analyze aggregate workforce data, capacity, cost, attrition risk, and skill coverage to support planning and budget decisions. Visier, Workday People Analytics, Crunchr, and cross-system platforms like Hobasa sit in this category. The unit of analysis is usually the team, department, or organization, not the individual.
Individual activity monitoring tools track what specific employees are doing, keystrokes, application usage, active time, and screenshots in some cases. Prodoscore, ActivTrak, and Insightful are examples. These tools answer a different question entirely: not "are we staffed correctly" but "what is this specific person doing right now."
Both get marketed as "workforce analytics." They are not substitutes for each other, and they carry very different privacy and trust implications for your employees. If your goal is capacity planning, labor cost visibility, or attrition forecasting, the first category is what you want. If your goal is monitoring individual activity, that is a different conversation entirely, with its own legal and cultural considerations worth thinking through carefully before buying.
Confusing the two categories during a vendor search wastes time on both sides. A capacity-planning platform will not tell you what an individual employee did at their desk on Tuesday, and an activity-monitoring tool will not tell you whether your labor cost is scaling appropriately with revenue. Naming which question you are actually trying to answer, before the first vendor call, is the single fastest way to shorten a workforce analytics search.
Why Workforce Data Breaks Down Across Systems
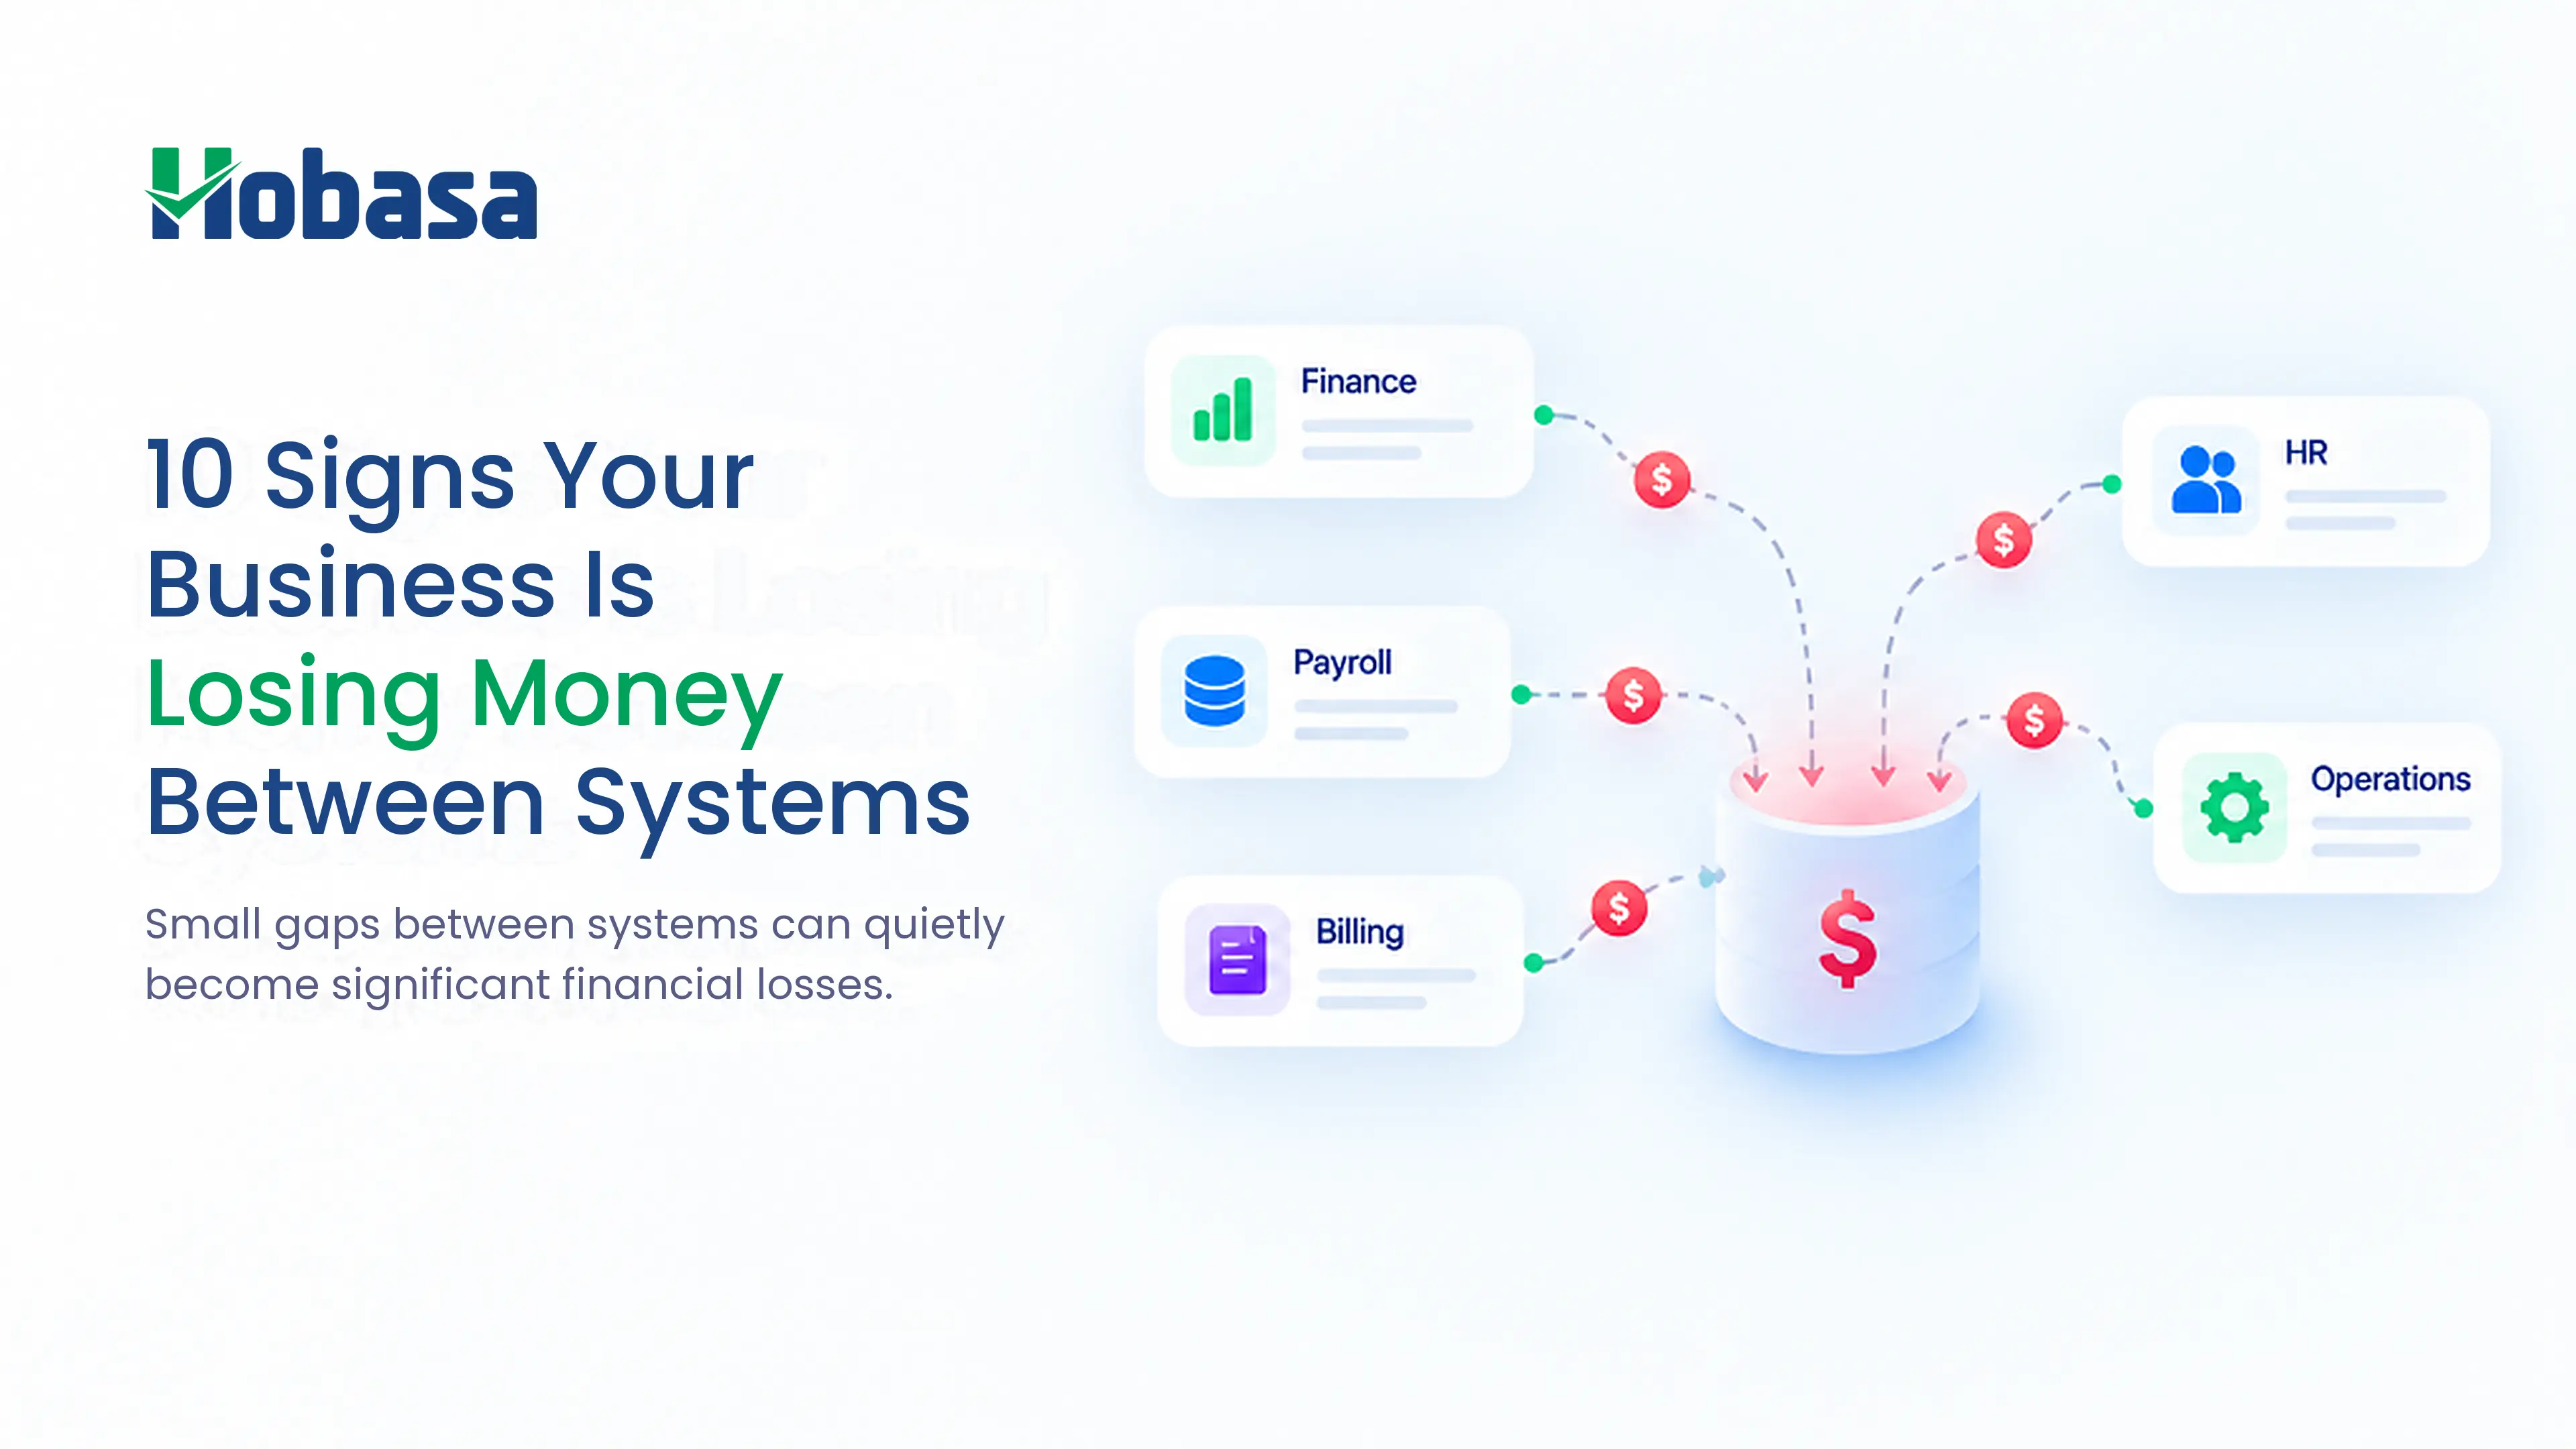
Capacity and labor cost questions are hard to answer well for a structural reason: the data that would answer them lives in at least three places that were never built to agree with each other.
The HRIS holds headcount and role data. Payroll holds actual hours, pay, and cost. Scheduling or operations tools hold planned versus actual coverage. A workforce analytics tool that only reads one of these will confidently answer part of the question and miss the rest. A dashboard built inside the HRIS will show planned headcount. A dashboard built inside payroll will show actual cost. Neither will tell you the two have drifted apart, because neither has visibility into the other.
This is precisely the gap a cross-system approach is built to close.
Tired of three tools answering the same workforce question differently?
Hobasa connects the systems behind your headcount, cost, and productivity metrics.
Get in touchWhy Choose Hobasa
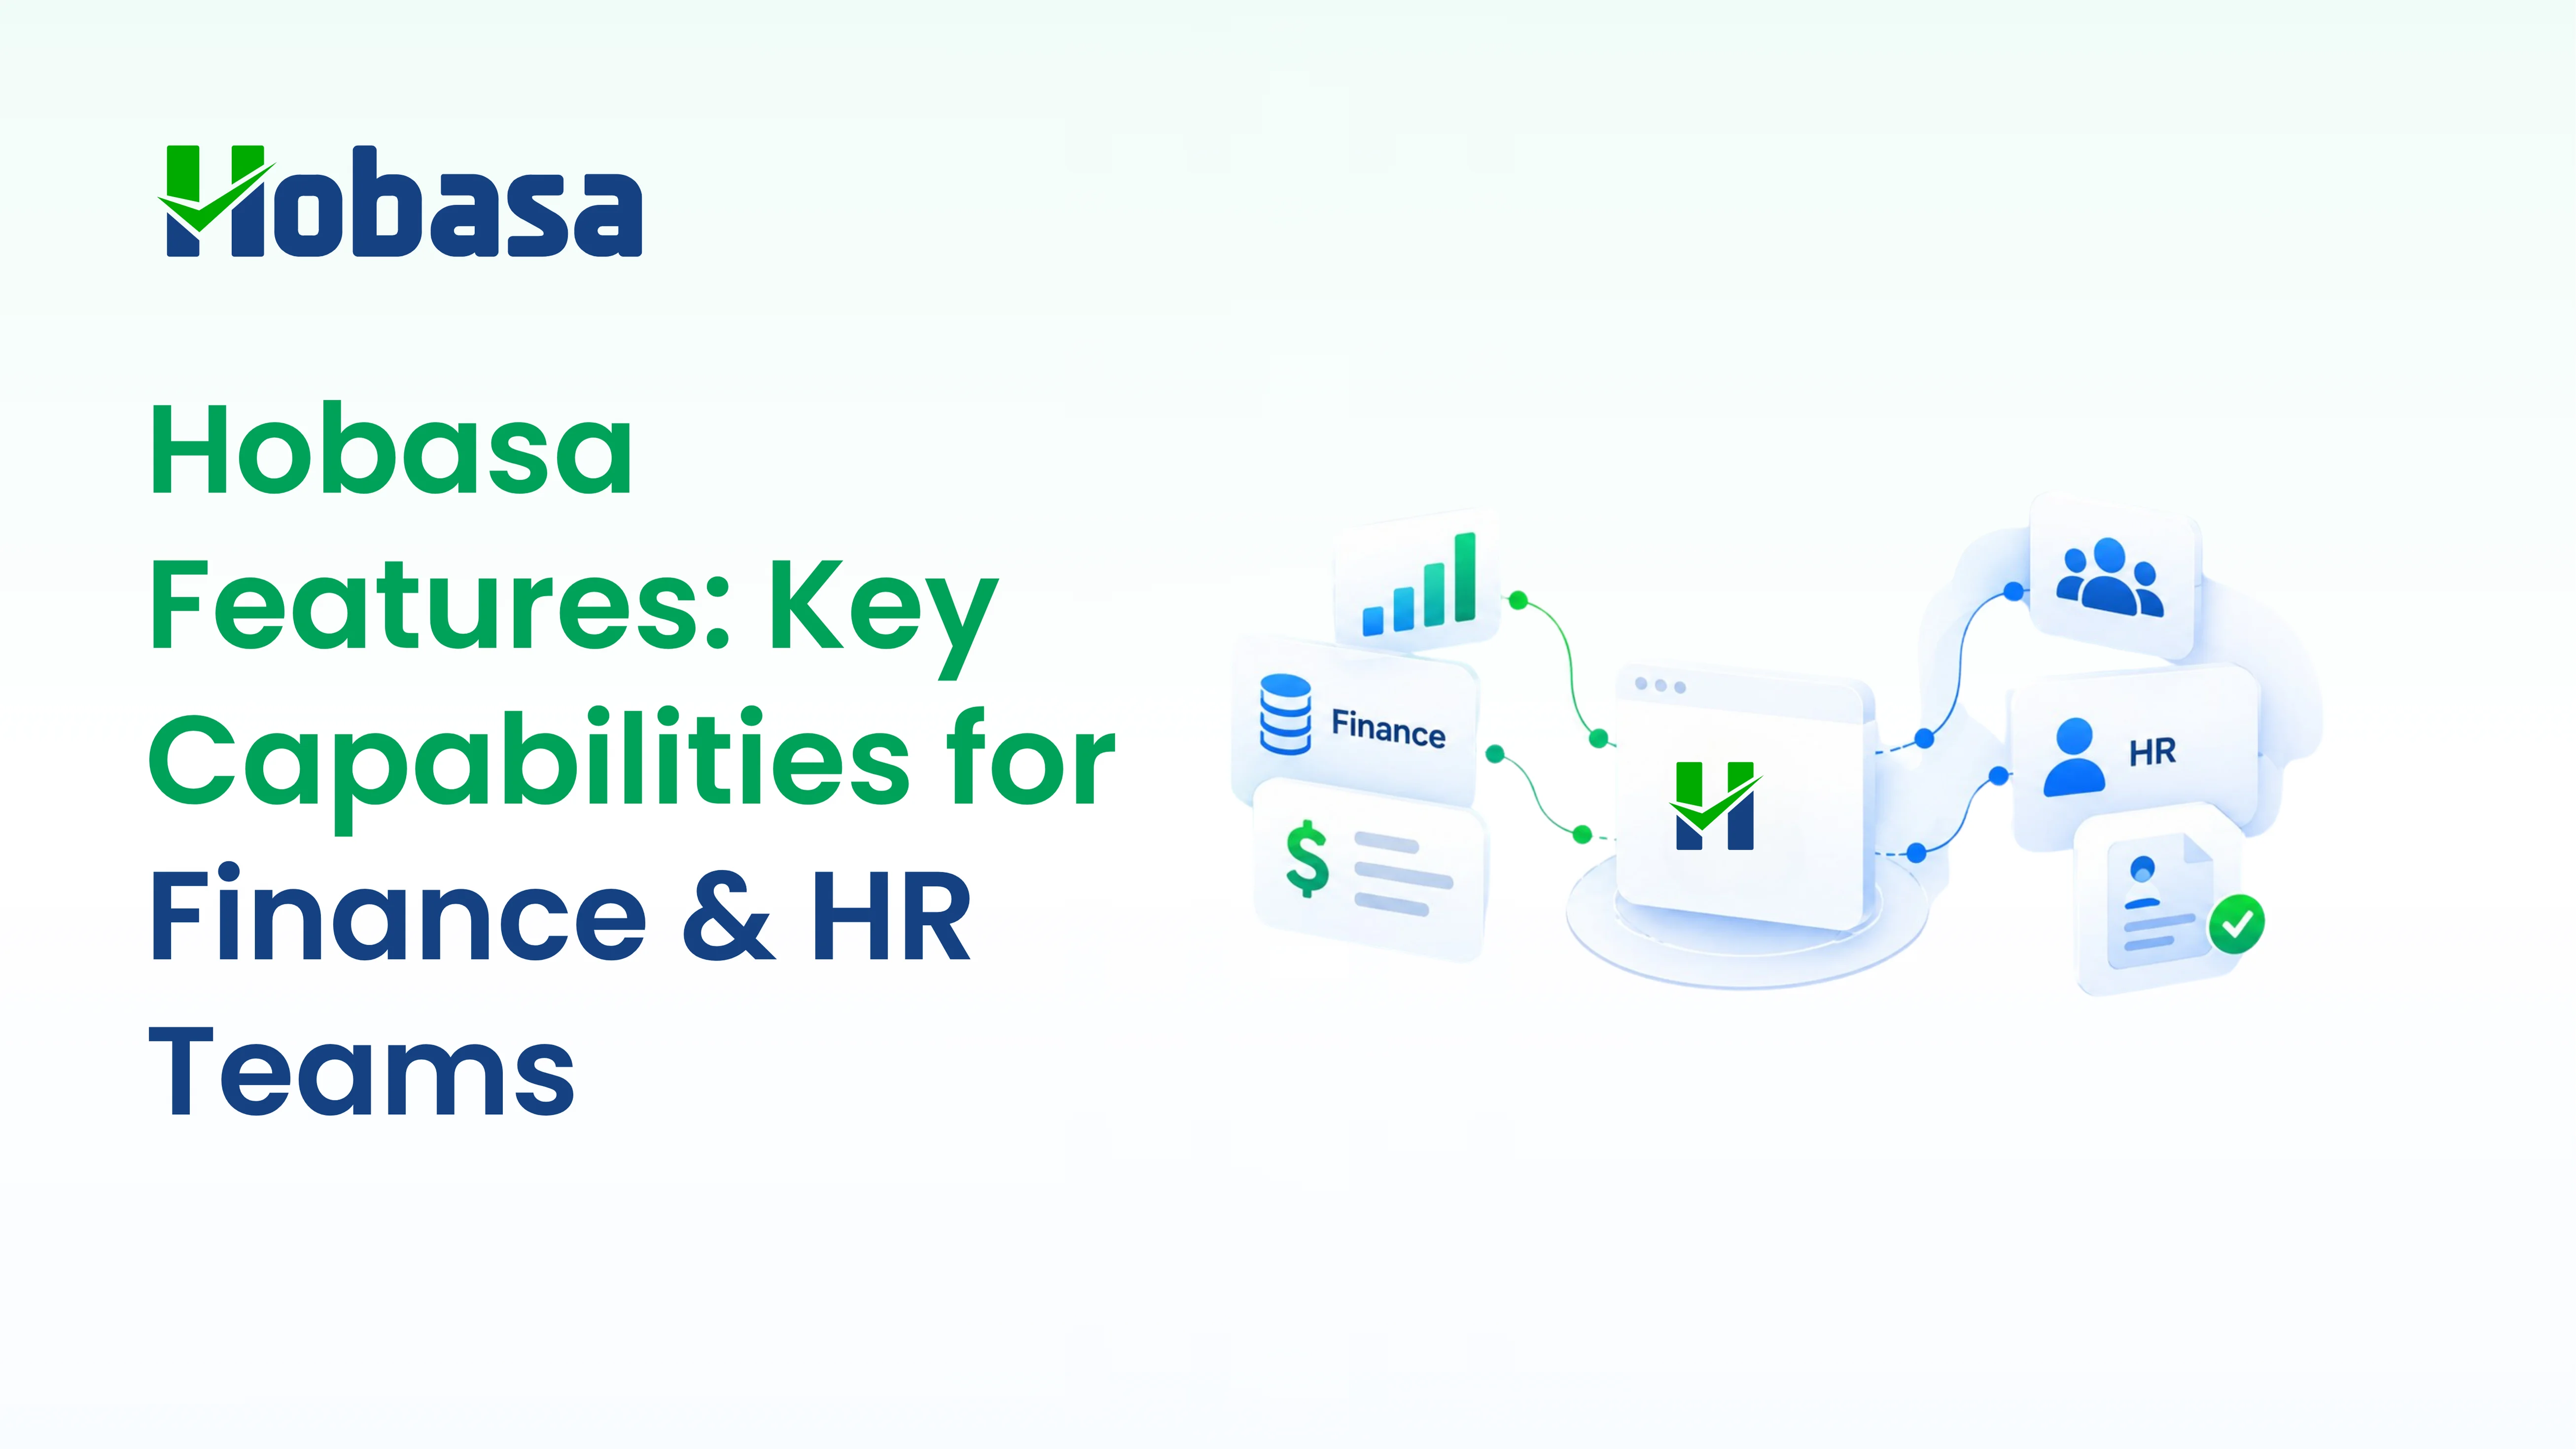
Hobasa is a cross-system intelligence layer, not an HRIS, payroll system, or scheduling tool. It connects to the systems a company already runs, HRIS, payroll, recruiting, finance, and operations, and reads across all of them at once.
For workforce analytics specifically, that means:
1. Labor cost and capacity questions get answered from the actual combined data, not from whichever single system happens to be open. Where HRIS-planned headcount and payroll-actual cost disagree, that disagreement is the finding, not a rounding error to smooth over.
2. Findings are source-grounded, citing the specific record they came from, a payroll line, a scheduling entry, an HRIS field, rather than a conclusion with no trail back to the data.
3. A person reviews every finding before it reaches a CFO, CHRO, or operations leader, following Hobasa's stated AI-assisted, human-reviewed approach.
4. Hobasa is not an individual activity monitoring tool. It works at the aggregate, cross-system level, capacity, cost, attrition risk, compliance, not keystrokes or screen time.
See how a cross-system view answers a capacity or cost question your current systems can't. Explore the Hobasa platform to see how findings get built from more than one system at once, cited, and reviewed before they reach you.
A scenario worth recognizing. A retail operator's scheduling tool shows three locations running below planned coverage for six weeks straight. Payroll, over the same period, shows overtime cost rising in two of those same locations. Neither system flags the connection, because neither has visibility into the other; the scheduling tool does not see payroll, and payroll does not see planned coverage. Read separately, this looks like two unrelated line items: a staffing gap and an overtime bump. Read together, it is one finding: under-scheduled locations covering the gap with overtime, at a real cost that a capacity-only or cost-only view would each miss half of. This is the kind of finding a cross-system layer is built to catch, and a single-system dashboard, however well designed, structurally cannot.
How to Choose Workforce Analytics Software in 2026
Start with the specific operational question, not a feature checklist.
1. Name the real question. "Are we overstaffed in three locations" is answerable. "We want better workforce data" is not a purchasing brief.
2. Confirm which category you actually need. Capacity and cost planning, or individual activity monitoring. They are not the same shopping list.
3. Check integration depth against your real systems, specifically HRIS, payroll, and whatever scheduling or operations tool holds planned-versus-actual data.
4. Ask how the platform handles disagreement between systems. A tool that silently picks one number is hiding the exact information you are paying to see.
5. Confirm the access model. Individual-level access should sit with direct managers and the employee; aggregate views should be what leadership sees.
6. Match timeline to urgency. A multi-month enterprise rollout is the wrong choice if the board wants a capacity answer next quarter.
7. Price the full cost, including the internal time to run it, not just the license fee.
Not sure whether your systems already have the answer? Talk to the Hobasa team and bring one real capacity or labor cost question your HRIS, payroll, and scheduling data currently answer differently.
Choosing workforce analytics in 2026?
See how Hobasa complements the stack you already have, without a rip-and-replace.
Talk to our teamTurn workforce data into connected intelligence.
Talk to the Hobasa team about your own capacity or labor cost questions and see how cross-system analysis can connect the data behind them.
FAQs
Workforce analytics software collects and analyzes operational workforce data, capacity, labor cost, utilization, and productivity, to help organizations plan and manage the workforce as a business resource. It typically pulls from HRIS, payroll, and scheduling or operations systems.
HR analytics typically focuses on department-level HR metrics like turnover and time-to-fill. Workforce analytics leans toward organization-level operational data such as capacity, labor cost, and productivity, often pulling in scheduling and operations data that HR-only tools do not touch.
No, though both get marketed under the same label. Workforce analytics platforms analyze aggregate, organization-level data for capacity and cost planning. Employee monitoring tools track individual activity, such as application usage or active time. They serve different purposes and carry different privacy considerations.
Common metrics include capacity utilization, labor cost as a share of revenue, productivity trends, attrition prediction, capacity forecasting, and skill coverage, in addition to standard headcount and turnover figures.
Some do, and this is exactly what separates a genuinely useful platform from an HR-only reporting tool. Since labor cost and capacity qs require payroll and often finance data, not just HRIS data, checking integration depth against these specific systems matters more than a generic "integrates with HR systems" claim.
Cost varies by category and depth. Embedded reporting inside an existing HRIS is often included. Dedicated capacity and cost-planning platforms carry separate licensing, and enterprise-grade tools add implementation time and internal staff cost on top of the license fee.
No. An HRIS remains the system of record for employee data and core administration. Workforce analytics software analyzes data, often pulled from the HRIS, payroll, and operations systems, to answer capacity and cost questions the HRIS was never built to answer on its own.